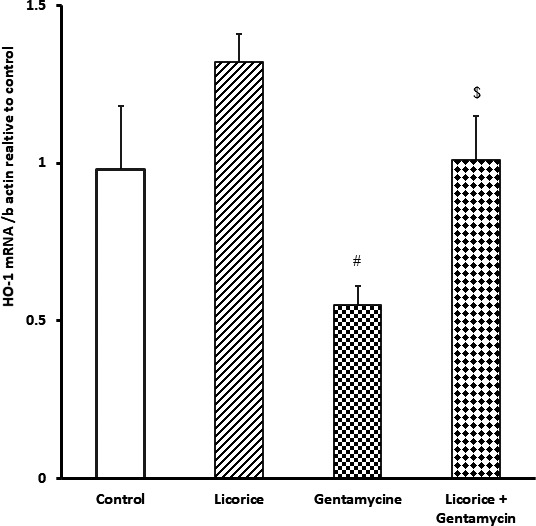
FIGURE 2.

Real‐time polymerase chain reaction expression of HO‐1 in different groups relative to control. Values are means ± standard error (SEM) for each treatment (n = 7). Values are statistically significant at # p <.05 versus control and Glycyrrhiza glabra groups, And at $ p <.05 versus gentamicin
