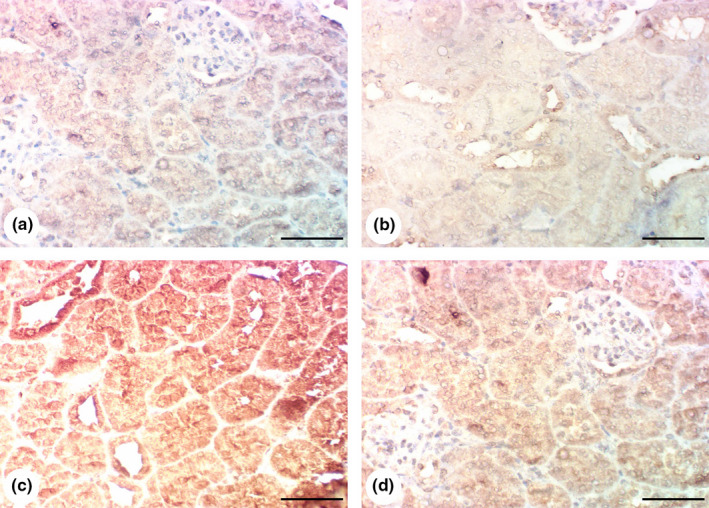
FIGURE 4.

Results of immunohistochemical examination of Cox‐2: (a, b) Kidneys of control and Glycyrrhiza glabra groups showing poor expression of Cox‐2 in renal tissue. (c) Kidney of gentamicin group showing overexpression of Cox‐2 in renal tissue. (d) Gentamicin + G. glabra group showing reduction of Cox‐2 expression. Scale bar = 50 μm
