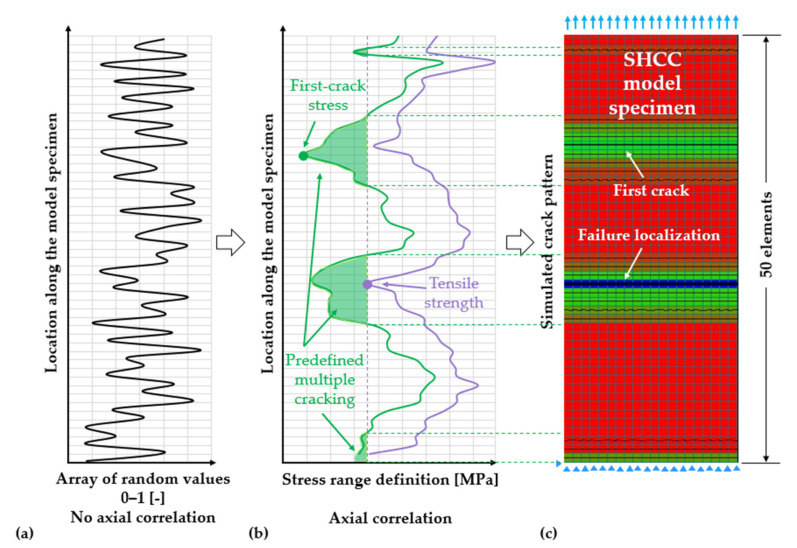
Figure 6.
(a) Elementwise distribution of axially non-correlated probabilistic values generated within normalized boundaries. (b) Axial correlation and range definition for the matrix strength and tensile strength. (c) Effect of the probabilistic distribution and axial fluctuation of matrix strength and tensile strength, as well as of the range overlap of these parameters on the degree and regions of multiple cracking in a plain SHCC model specimen.

