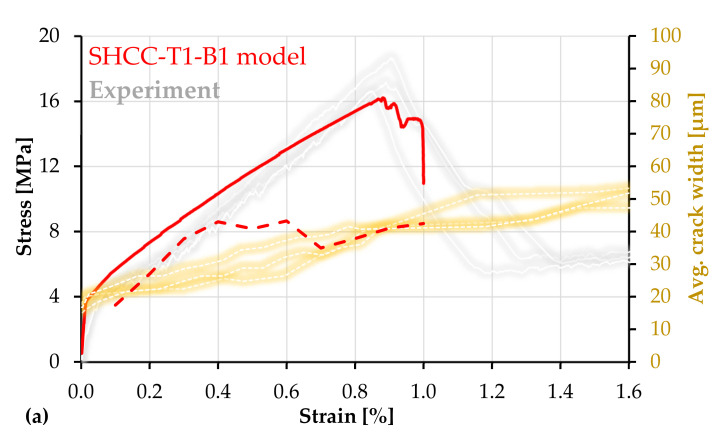
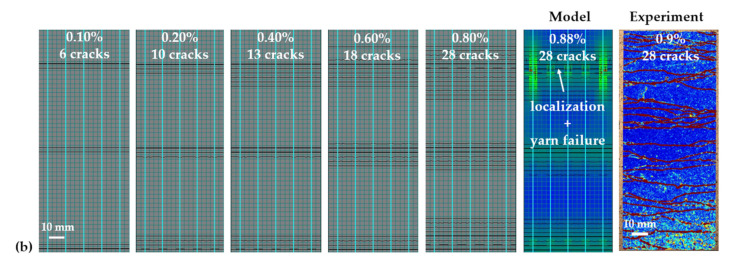
Figure 14.
(a) Macroscopic stress–strain curve (continuous) and average crack widths (dashed) of SHCC-T1-B1 model composite with experimental results adopted from [13]; (b) crack pattern and sequence in the loaded model including the principal stresses in SHCC at yarn failure and a representative experimental crack pattern based on DIC analysis.


