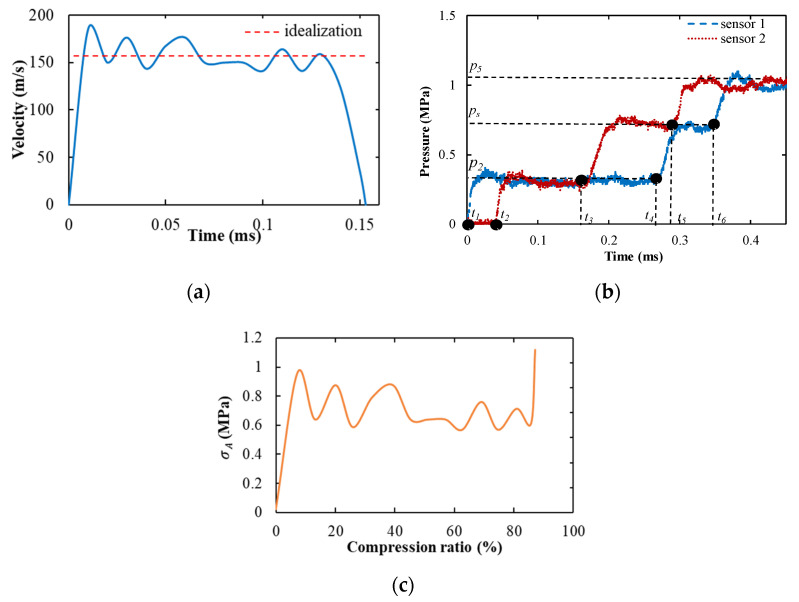
Figure 8.
The testing results in the shock tube test: (a) the diagram of the velocity of the compression deformation as a function of the time, here, the blue line represents the experiment velocity and the red line represents the idealized velocity, and the average velocity of the compression is about 155 m/s; (b) the typical corresponding pressure–time curve of the shock tube, here, the blue line represents the pressure recorded by sensor 1 and the red line represents the pressure recorded by sensor 2, ps represents the first reflected wave, and p5 represents the second reflection wave; (c) the dynamic crushing stress σA as a function of the specimen compression ratio in the shock tube experiment, which was calculated by Equation (6).

