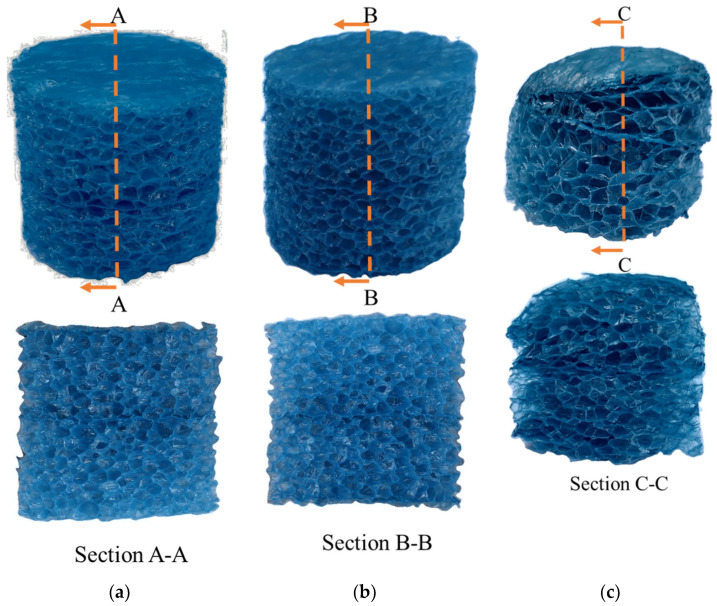
Figure 9.
The final deformation of the foam under different loading rates, the bottom figures are the cross section of the specimens cut along the section marked in the top figures: (a) specimen failed under the quasi-static loading; (b) specimen failed under intermediate strain rate loading; (c) specimens failed under high strain rate loading.

