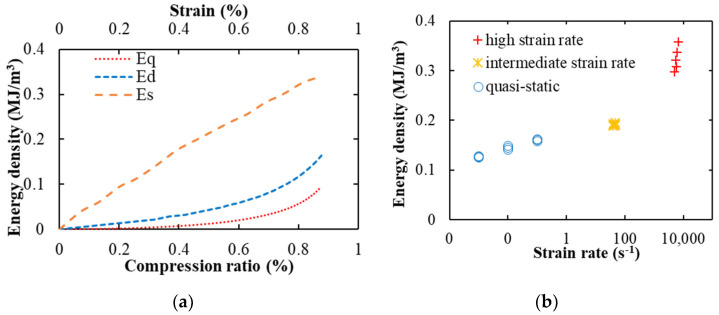
Figure 11.
The energy absorption of the foam under the different strain rates: (a) the diagram of the energy absorption as a function of the compression ratio, the red line (Eq) represents the energy absorption of the foam in the hydraulic test, the blue line (Ed) represents the energy absorption of the foam in the drop weight test, and the orange line (Es) represents the energy absorption of foam in the shock tube test; (b) the energy absorptions of the foam under the different strain rates, here, the energy absorption value was greatly affected by velocity under the shock mode.

