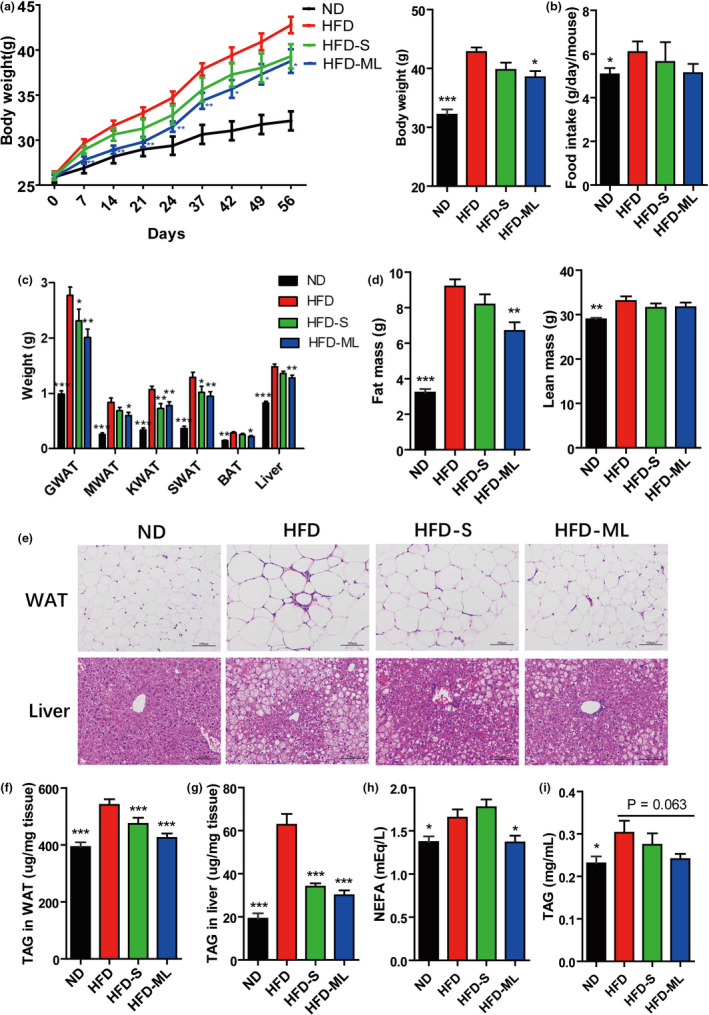
FIGURE 1.

Inulin addition prevents diet‐induced obesity and fatty liver with a better effect of ML Inulin than S inulin. (A) Growth curve reflected by body weight. (B) Food intake. (C) Weights of fat pads and liver. (D) Fat and less masses. (E) Hematoxylin–eosin staining. Scale bars, 100 μm. (F) TAG content in WAT and (G) TAG content in liver. (H) Serum NEFA. (I) Serum TAG. Data represent the mean ± SEM from eight mice (n = 8). Significance was established using a two‐tailed Student's t‐test and all comparisons are relative to HFD group. *p <.05, **p <.01, and ***p <.001
