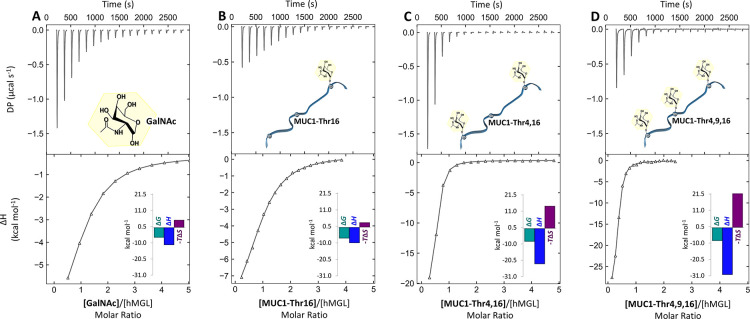
Figure 2.
Selected ITC binding curves, including thermographic profiles for interaction of (A) GalNAc (1.50 mM) with hMGL (29.6 μM), (B) MUC1-Thr16 (0.50 mM) with hMGL (22 μM), (C) MUC1-Thr4,16 (0.50 mM) with hMGL (20 μM), and (D) MUC1-Thr4,9,16 (0.25 mM) with hMGL (20 μM) in buffered H2O determined by ITC. Isotherms and thermograms were reproduced in GUSSI version 1.4.2 from the data obtained by MicroCal PEAQ-ITC software.

