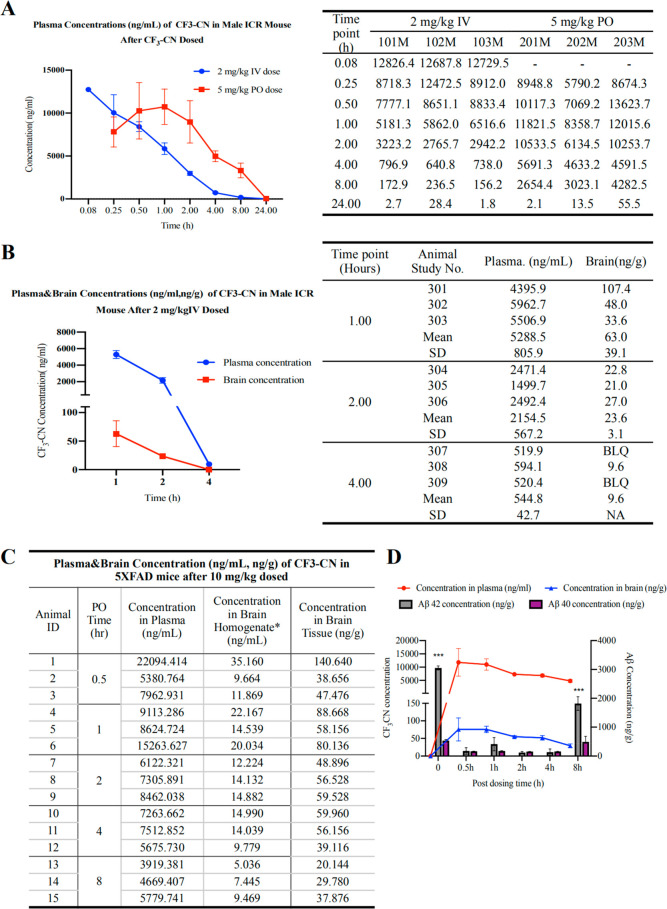
Figure 4.
In vivo PK study of CF3CN and PD/PK relationship. (A) In vivo PK study. ICR mice were given 2 mg/kg (i.v.) or 5 mg/kg (P.O.) CF3-CN, and blood samples were collected from all three mice at indicated time points. CF3CN was quantitatively analyzed by LC-MS/MS. (B) CF3CN brain exposure from intravenous administration of CF3CN. Three ICR mice were given 2 mg/kg CF3CN, which was dissolved in DMSO then resuspended in 95% methylcellulose (0.5%, wt/vol), and the final DMSO concentration is 5% (5% DMSO/95% methylcellulose, vol/vol). At indicated time points, blood samples were collected from all three mice. CF3CN was quantitatively analyzed by LC-MS/MS. (C) Nine ICR mice were given 2 mg/kg CF3CN, which was dissolved in DMSO then resuspended in 95% methylcellulose (0.5%, wt/vol), and the final DMSO concentration is 5% (5% DMSO/95% methylcellulose, vol/vol). At indicated time points, three mice per group were sacrificed, and serum and brain samples were collected. CF3CN was quantitatively analyzed by LC-MS/MS. (D) Quantitative Aβ40 and 42 ELISA analysis in the brain lysates at different time points after oral administration of CF3CN.

