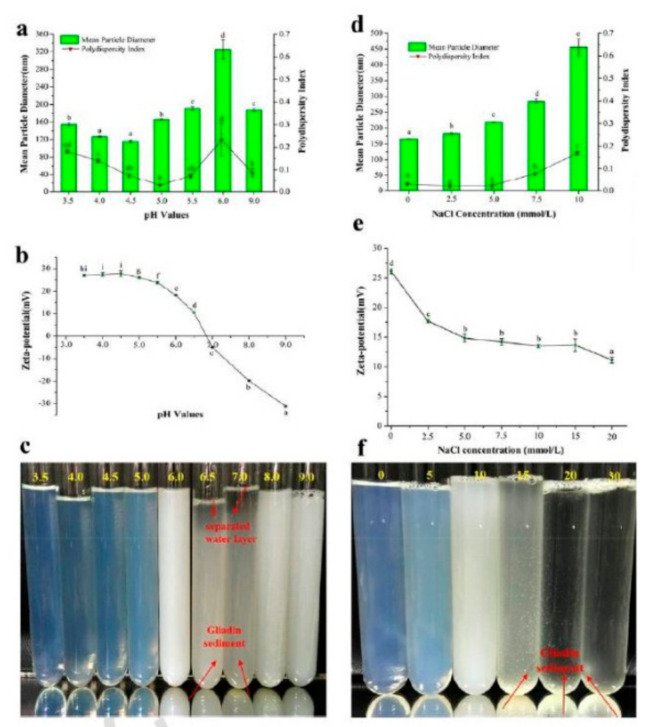
Figure 13.
Changes in the size and zeta potential properties of gliadin nanoparticles with different pH (a,b) and NaCl concentrations (d,e). Visual images of the gliadin nanoparticles at different pHs (c) and NaCl concentrations (f). Reprinted with permission from ref. [90]. Copyright 2018 Taylor and Francis.

