Figure.
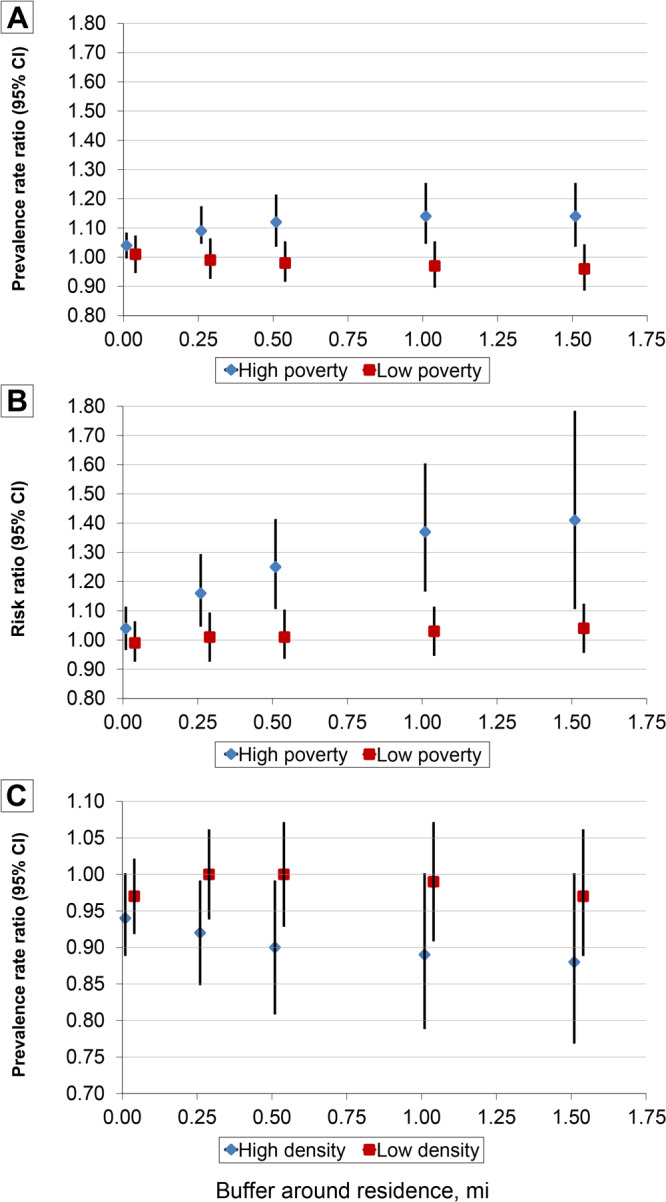
Association between built environment scores in buffers around residence and incident and prevalent depression among participants (N = 2,000) in the Bogalusa Heart Study, 1998–2013. High poverty is defined as ≥28.3% of residents (of a census tract) living below the federal poverty level; low poverty is defined as <28.3% of residents (of a census tract) living below the federal poverty level. High density is defined as ≥586 residents (of a census tract) per square mile of area; low density is defined as <586 residents (of a census tract) per square mile of area. Graph A shows prevalence rate ratio (PRR) for a 1-point increase in pedestrian safety score. Graph B shows the risk ratio (RR) for a 1-point increase in destination score, and graph C shows the PRR for a 1-point increase in aesthetics score.
| A. Buffer Radius, mi | High Poverty, PRR (95% CI) | Low Poverty, PRR (95% CI) |
|---|---|---|
| 0.00 | 1.04 (1.00 to 1.08) | 1.01 (0.95 to 1.07) |
| 0.25 | 1.09 (1.01 to 1.17) | 0.99 (0.93 to 1.06) |
| 0.50 | 1.12 (1.04 to 1.21) | 0.98 (0.92 to 1.05) |
| 1.00 | 1.14 (1.05 to 1.25) | 0.97 (0.90 to 1.05) |
| 1.50 | 1.14 (1.04 to 1.25) | 0.96 (0.89 to 1.04) |
| B. Buffer Radius, mi | High Poverty, RR (95% CI) | Low Poverty, RR (95% CI) |
| 0.00 | 1.04 (0.97 to 1.11) | 0.99 (0.93 to 1.06) |
| 0.25 | 1.16 (1.05 to 1.29) | 1.01 (0.93 to 1.09) |
| 0.50 | 1.25 (1.11 to 1.41) | 1.01 (0.94 to 1.10) |
| 1.00 | 1.37 (1.17 to 1.60) | 1.03 (0.95 to 1.11) |
| 1.50 | 1.41 (1.11 to 1.78) | 1.04 (0.96 to 1.12) |
| C. Buffer Radius, mi | High Density, PRR (95% CI) | Low Density, PRR (95% CI) |
| 0.00 | 0.94 (0.89 to 1.00) | 0.97 (0.92 to 1.02) |
| 0.25 | 0.92 (0.85 to 0.99) | 1.00 (0.94 to 1.06) |
| 0.50 | 0.90 (0.81 to 0.99) | 1.00 (0.93 to 1.07) |
| 1.00 | 0.89 (0.79 to 1.00) | 0.99 (0.91 to 1.07) |
| 1.50 | 0.88 (0.77 to 1.00) | 0.97 (0.89 to 1.06) |

