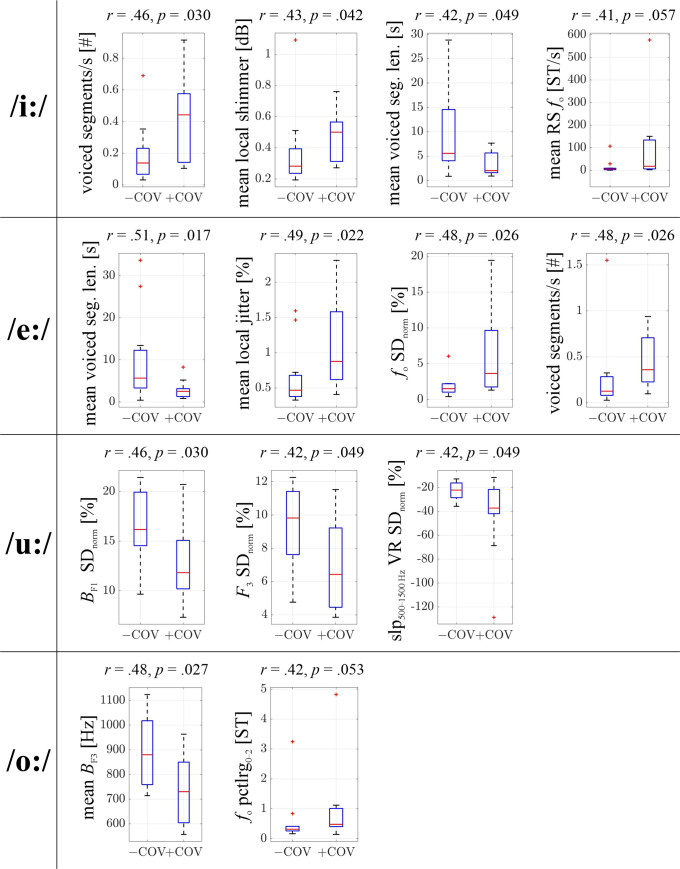
FIG. 1.
(Color online) Vowel-wise acoustic feature comparisons between COVID-19 negative (–COV) and COVID-19 positive (+COV) participants in form of boxplots for features with a differentiation effect r > 0.4 ordered from left to right according to a decreasing r, respectively. The effect size r as well as the p-value of the Mann-Whitney U difference test are given above each boxplot. r is rounded to two decimal places. p is rounded to three decimal places. Level of significance after Bonferroni correction: 7 × 10⁻⁴. Outliers (marked with red plus symbols) are defined as values that are more than 1.5 times the interquartile range away from the bottom or top of the respective box. # = number of, BF1,3 = bandwidth of first and third vowel formant, fo = fundamental frequency, F3 = frequency of third vowel formant, len. = length, pctlrg = percentile range, RS = rising slope, seg. = segment, ST = semitone from 27.5 Hz, SDnorm = standard deviation normalised by the arithmetic mean (coefficient of variation), slp = slope, VR = voiced regions.

