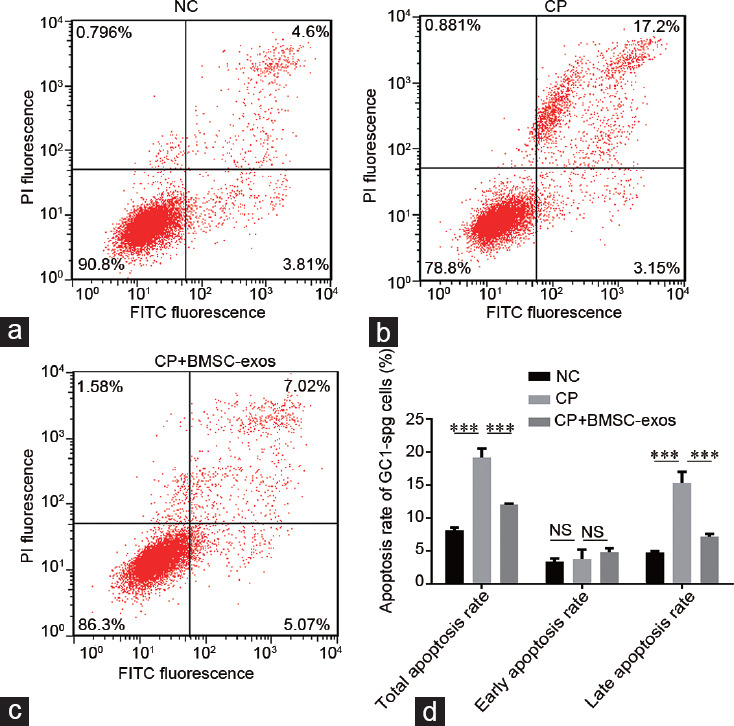
Figure 4.

Flow cytometry analysis of cell apoptosis. (a) NC. (b) CP. (c) CP + BMSC-exos. (d) Statistical analysis of the apoptosis rate of GC1-spg cells in the indicated groups. The apoptosis rate of the CP-treated cells was significantly higher than that in the NC cells, while the apoptosis rate of the CP + BMSC-exos cells was significantly lower than those in the CP-treated cells; ***P < 0.001. NC: negative control; CP: cyclophosphamide-treated group; BMSC-exos: bone marrow mesenchymal stem cell-derived exosomes; NS: no significance; PI: Propidium Iodide; GC1-spg: GC1 spermatogonia; FITC: fiber to the last amplifier.
