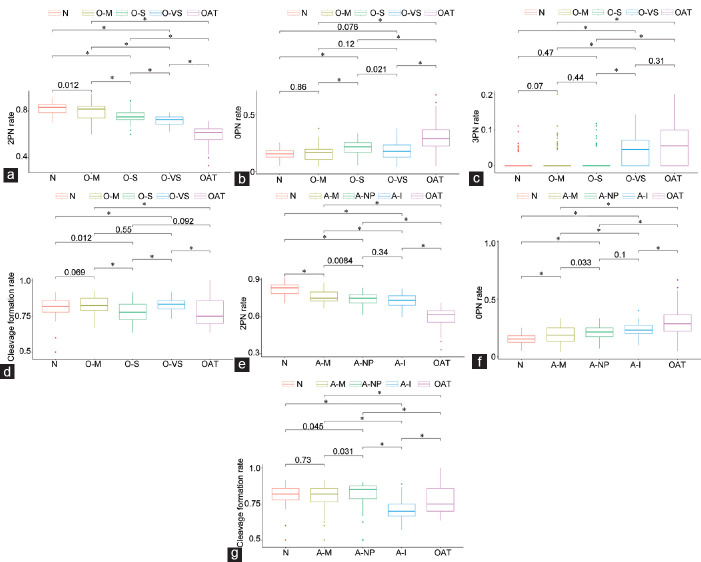
Figure 2.
Graphical representation of statistically significant findings in the asthenozoospermic subgroups compared to those of the normal and oligoasthenoteratozoospermic groups. (a) The 2PN rate in the oligozoospermic subgroups compared to that of the normal and oligoasthenoteratozoospermic groups. (b) The 0PN rate in the oligozoospermic subgroups compared to that of the normal and oligoasthenoteratozoospermic groups. (c) The 3PN rate in the oligozoospermic subgroups compared to that of the normal and oligoasthenoteratozoospermic groups. (d) The cleavage formation rate in the oligozoospermic subgroups compared to that of the normal and oligoasthenoteratozoospermic groups. (e) The 2PN rate in the asthenozoospermic subgroups compared to that of the normal and oligoasthenoteratozoospermic groups. (f) The 0PN rate in the asthenozoospermic subgroups compared to that of the normal and oligoasthenoteratozoospermic groups. (g) The cleavage formation rate in the asthenozoospermic subgroups compared to that of the normal and oligoasthenoteratozoospermic groups. Statistical significance is set at P = 0.00625. PN: pronuclei; N: Normal; A-M: the mild asthenozoospermic subgroup; A-NP: nonprogressive asthenozoospermic group; A-I: the immotility group; O-M: oligozoospermia-mild; O-S: oligozoospermia-severe; O-VS: oligozoospermia-very severe; OAT: oligoasthenozoospermia.

