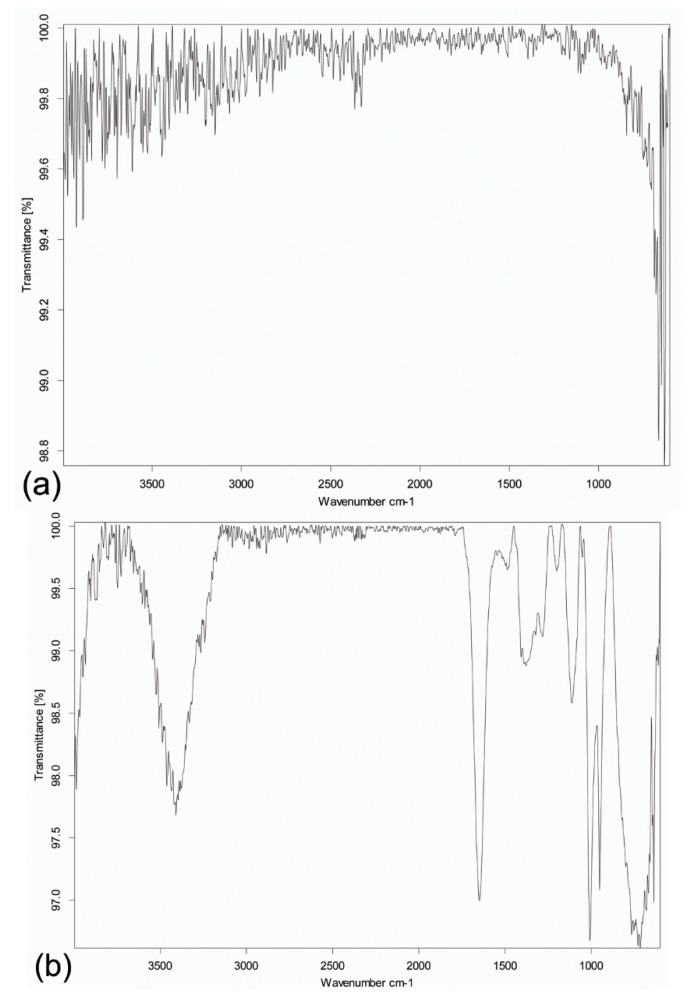
Figure 5.
Representative Fourier-transformed infrared spectra of the titanium discs. (a) Spectrum of the sandblasted, large-grit, acid-etched surface-treated titanium disc. (b) Spectrum of the same kind of disc but further immersed in simvastatin solution. Note the distinct bands of the functional groups OH (3600–3200 cm−1) and C=O (1800–1600 cm−1), which are present on simvastatin. The characteristic fingerprint region of simvastatin occurring at <1500 cm−1 further confirms alteration of the surface of the titanium disc upon simvastatin treatment.

