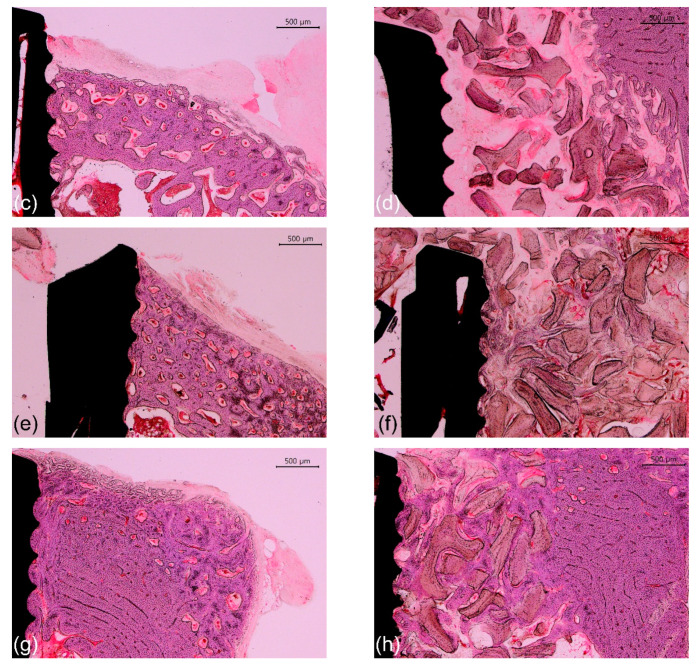
Figure 7.
Representative photomicrographs (40× magnification) of hematoxylin and eosin-stained histological sections of rabbit tibias at the implanted regions. (a) Group C-2, nongrafted side; (b) Group C-2, grafted side; (c) Group SU-2, nongrafted side; (d) Group SU-2, grafted side; (e) Group C-4, nongrafted side; (f) Group C-4, grafted side; (g) Group SU-4, nongrafted side; and (h) Group SU-4, grafted side. Note the sparse amount of new bone on the grafted side in 2-week groups. Scale bars: 500 μm.


