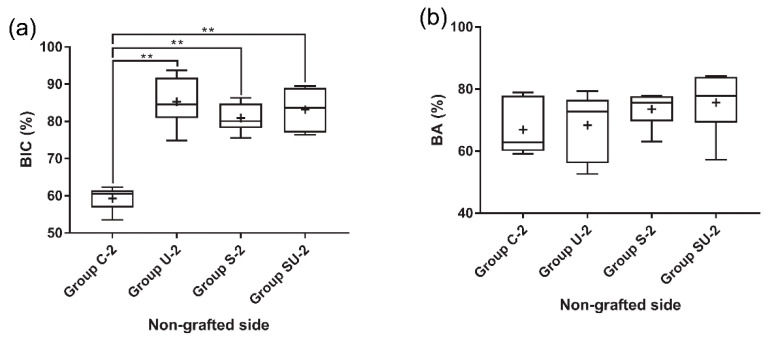
Figure 8.
Histomorphometric analyses of the experimental groups. The grafted sides of 2-week groups were not analyzed due to a sparse amount of new bone in the vicinity of the implants. (a) BIC at the nongrafted side of the 2-week group; (b) BA at the nongrafted side of the 2-week group; (c) BIC at the nongrafted side of the 4-week group; (d) BA at the nongrafted side of the 4-week group; (e) BIC at the grafted side of the 4-week group; and (f) BA at the grafted side of the 4-week group. Asterisks indicate statistically significant differences among the groups (** p < 0.01). The lines inside the boxes indicate median values, and the cross signs inside the boxes indicate mean values. The borders of the boxes indicate the 25th and 75th percentiles. The whiskers indicate the minimum and maximum values. BIC, bone-to-implant contact; BA, bone area.


