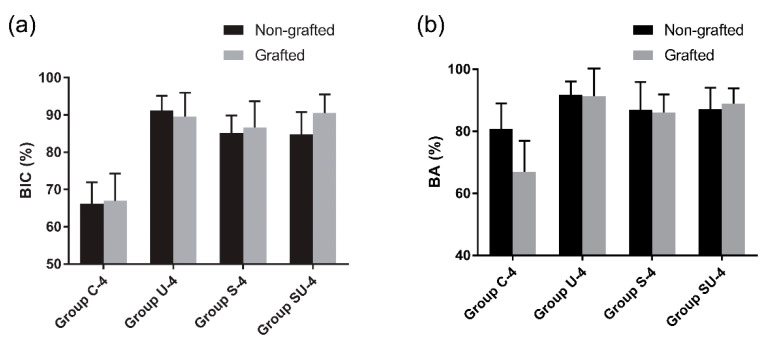
Figure 9.
Comparisons between the nongrafted sides and the grafted sides in the 4-week group, as evaluated by histomorphometry. (a) BIC; (b) BA. Data are expressed as mean ± standard deviations. Error bars show the standard deviations. Note that there is no significant difference between the nongrafted sides and the grafted sides in terms of BIC and BA (p > 0.05), regardless of the treatment methods used. BIC, bone-to-implant contact; BA, bone area.

