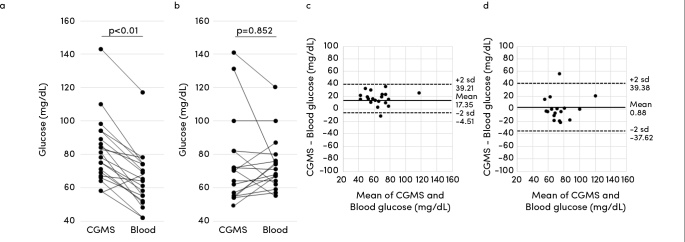
Figure 4. a–d.
(a and b) Differences between CGMS and blood glucose values in each pair of measurements. Data were obtained (a) within (n=20 pairs) and (b) from (n=17 pairs) 3 hours after CGMS placement. (c and d) Bland-Altman plot. CGMS versus blood glucose values. The straight line shows the mean difference between CGMS and blood glucose values, and the two dotted lines show ±2 standard deviations. Data were obtained (c) within (n=20 pairs) and (d) from (n=17 pairs) 3 hours after CGMS placement
CGMS, continuous glucose monitoring systems

