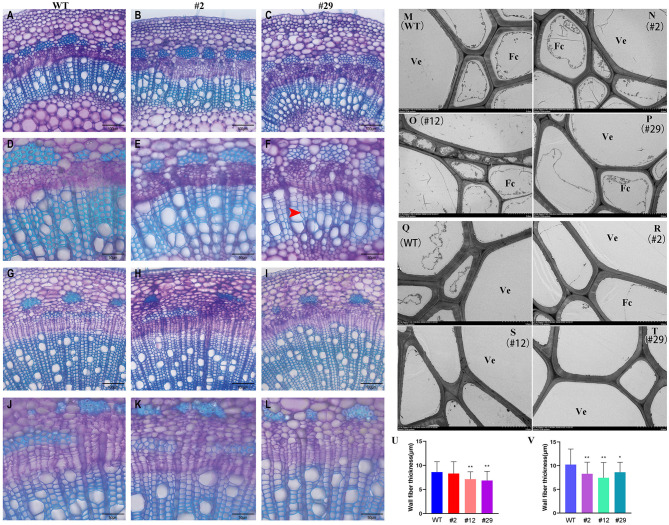
Figure 7.
Comparison of xylem structure between P. alba × P. glandulosa BLH6a dominant repression transgenics and WT. (A–L) Light microscopy. (A–C) Cross sections of the seventh internode from WT (A), transgenic lines 2 (B), and 29 (C) at 200 magnification. (D–F) Cross sections of the seventh internode from WT (D), transgenic lines 2 (E), and 29 (F) at 400 magnification. (G–I) Cross sections of the 14th internode from WT (G), transgenic lines 2 (H), and 29 (I) at 200 magnification. (J–L) Cross sections of the 14th internode from WT (J), transgenic lines 2 (K), and 29 (L) at ×400 magnification. Bars = 100 μm in (A–C, G–I) and 50 μm in (D–F, J–L). The red arrow shows the thinner cell wall. (M–T) Transmission electron microscopy. (M–P) Cross-sections of the eighth internode from WT (M), transgenic lines 2 (N), 12 (O), and 29 (P). (Q–T) Cross-sections of the 14th internode from WT (Q), transgenic lines 2 (R), 12 (S), and 29 (T). Bars = 5 μm. Ve, Vessel; Fc, Fiber cell. (U,V) Statistics of fiber cell wall thickness in the eighth internode (U) and the 14th internode (V) of WT, transgenic lines 2, 12, and 29. *p < 0.05, **p < 0.01, determined by the Student's t-test.

