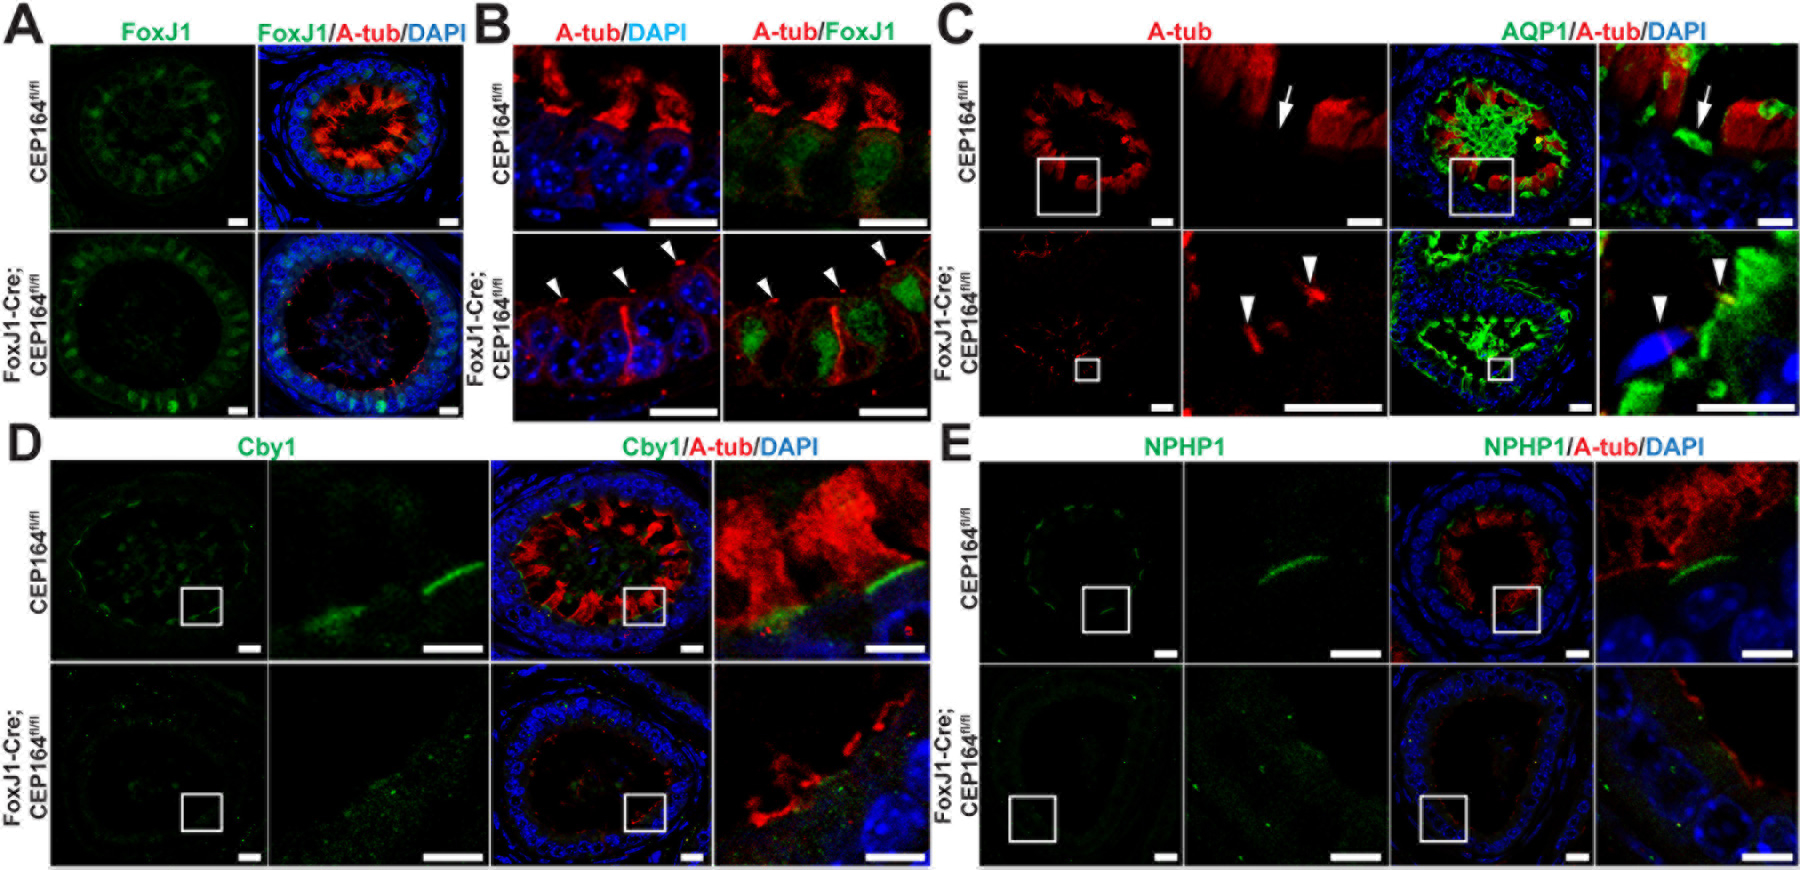
Fig 6. Marker analysis of the efferent ductal epithelium.

(A and B) IF staining of ED sections for A-tub and the MCC marker FoxJ1. Arrowheads in (B) point to the primary cilia of secretory cells in FoxJ1-Cre;CEP164 EDs. Scale bars, 10 µm. (C) IF staining of ED sections for A-tub and the secretory cell marker aquaporin 1 (AQP1). The boxed areas are magnified on the right. Arrows denote AQP1-positive secretory cells. Arrowheads point to the primary cilia of secretory cells. Scale bars, 10 µm and 5 µm (magnified images). (D) IF staining of ED sections for A-tub and Cby1, a CEP164-binding basal body protein. The boxed areas are enlarged on the right. Scale bars, 10 µm and 5 µm (enlarged images). (E) IF staining of ED sections for A-tub and the transition zone protein NPHP1. The boxed areas are magnified on the right. Scale bars, 10 µm and 5 µm (magnified images). Nuclei were detected with DAPI.
