
Figure 1. Predictive performance of regression (Reg), gradient boosting (GB), and random forests (RF) in predicting kidney transplant outcomes, as measured in the C-statistic.
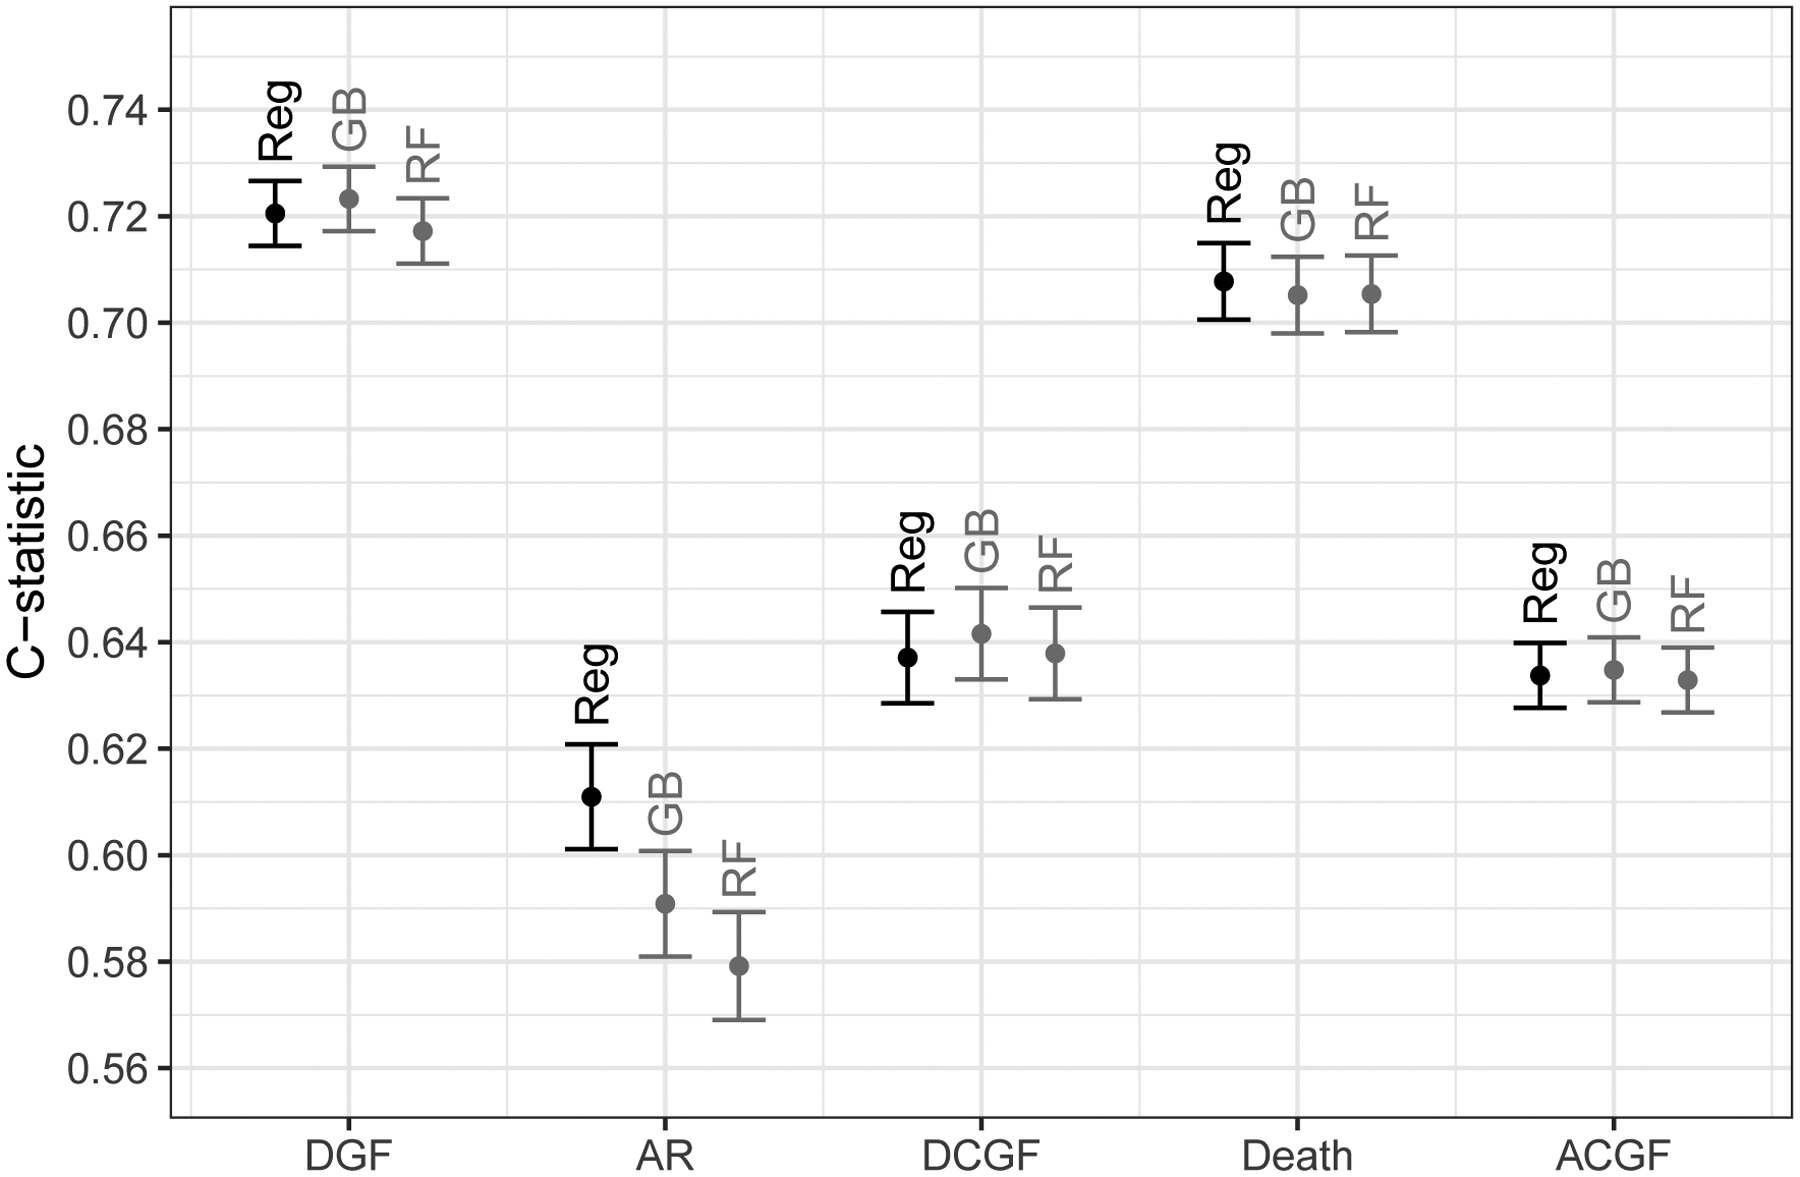
DGF, delayed graft function; AR, one-year acute rejection; DCGF, death-censored graft failure; and ACGF, all-cause graft failure. Regression represents logistic regressions for delayed graft function and acute rejection, and Cox regressions for death-censored graft failure, death, and all-cause graft failure. Y-axis indicates the area under the receiver operating characteristic curve (AUROC) for delayed graft function and acute rejection, and Harrell’s concordance statistic for death-censored graft failure, death, and all-cause graft failure.