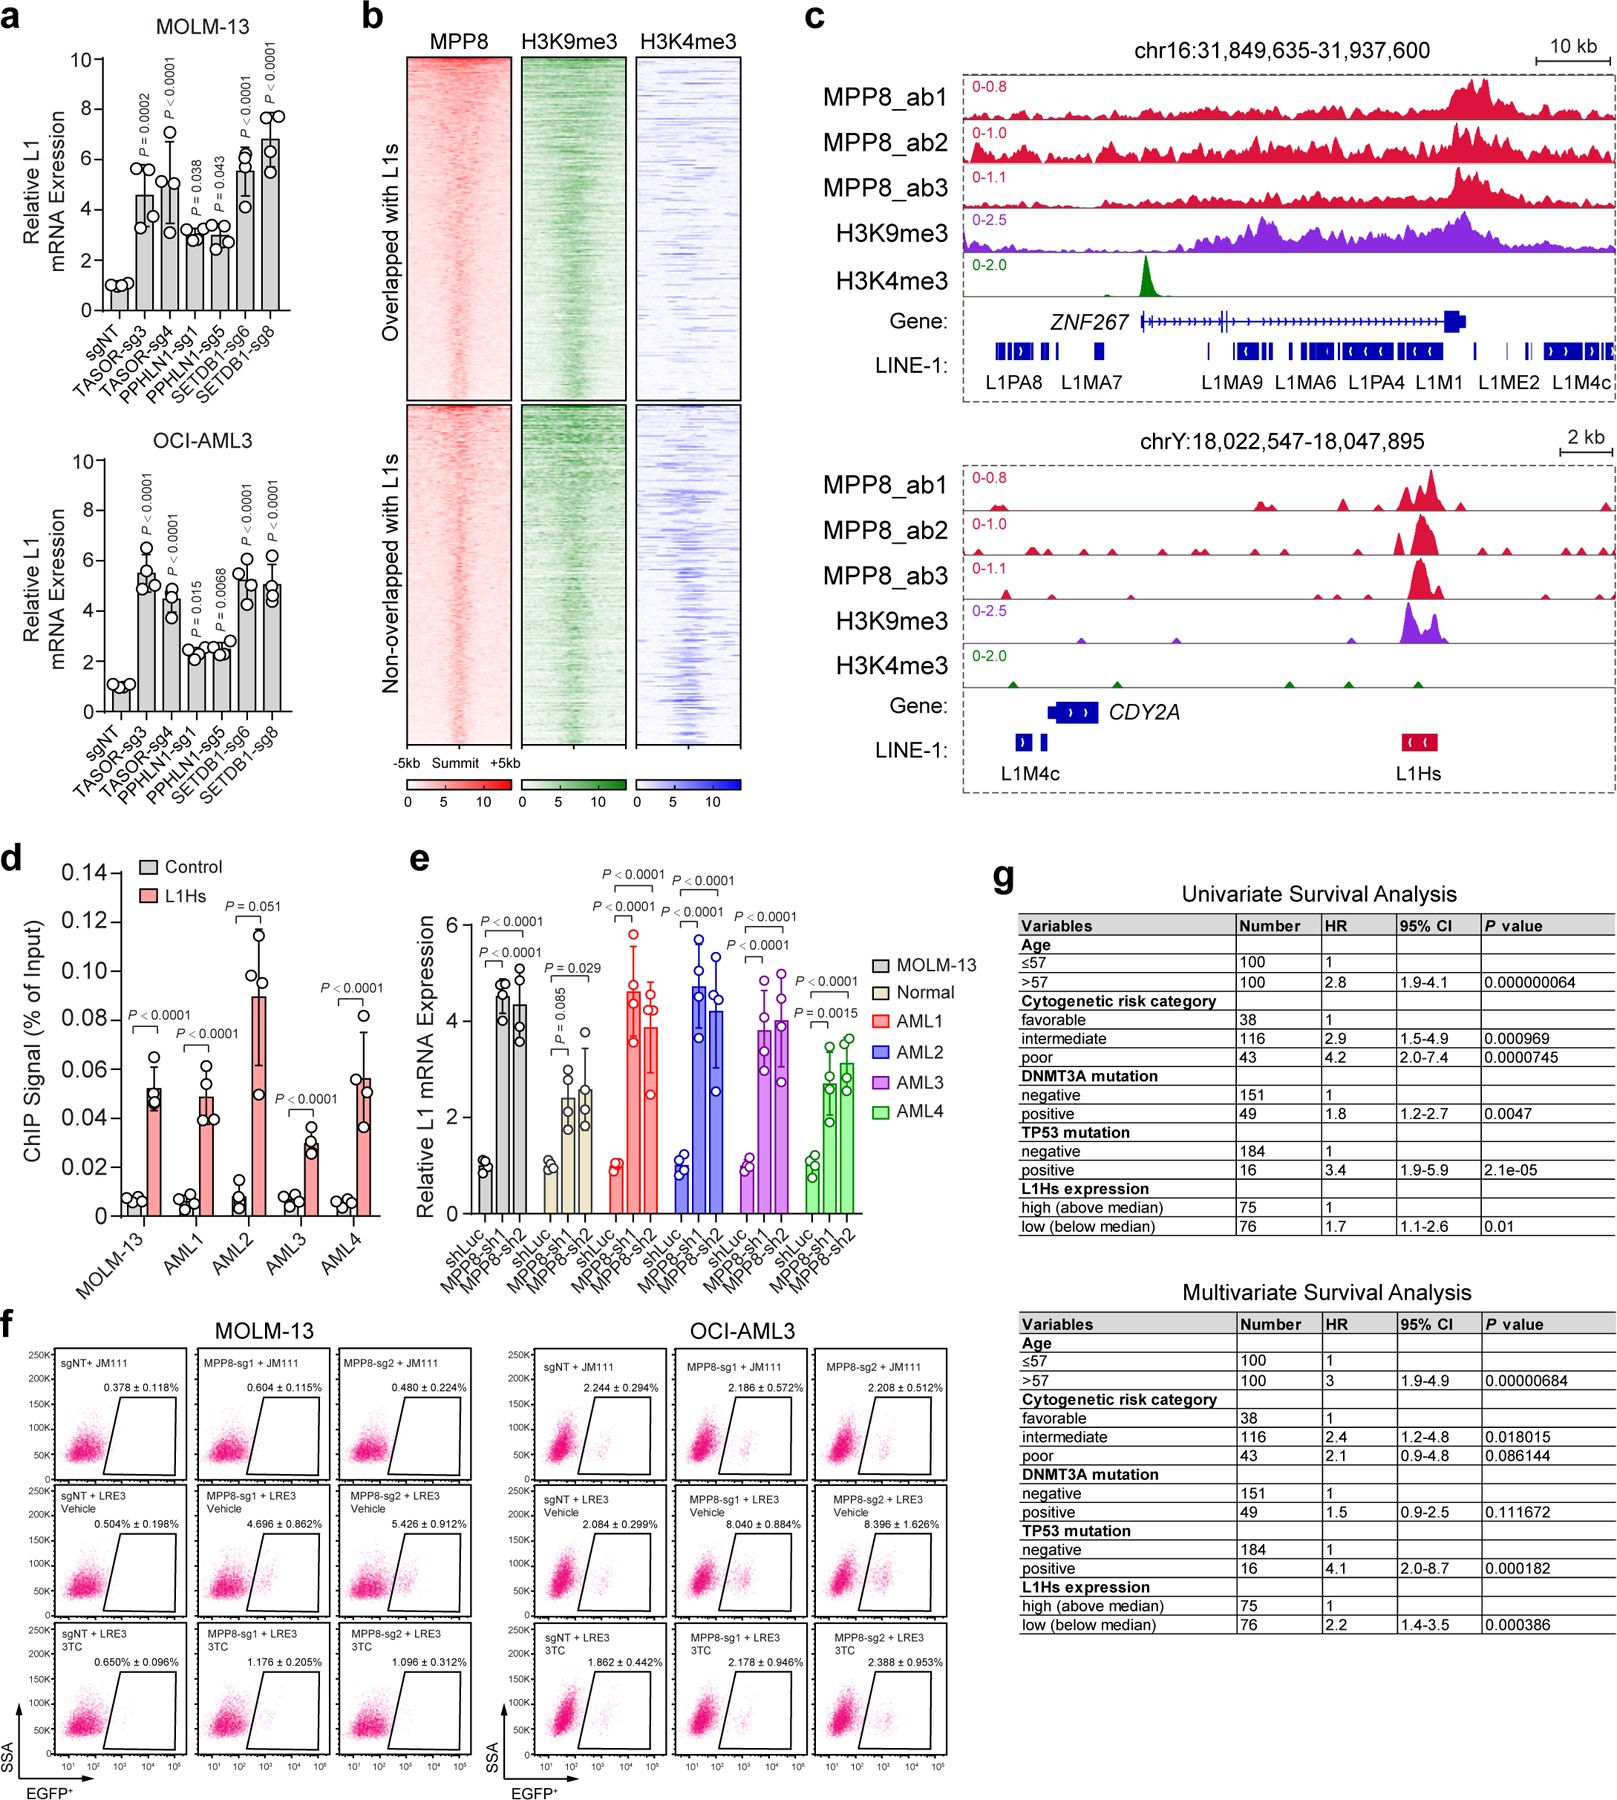
Extended Data Figure 6 |. Expression and regulation of L1 retrotransposons in myeloid leukemia.

a, Expression of young L1s was significantly upregulated upon depletion of other HUSH components or SETDB1. Results are mean ± SD (N = 4 experiments) and analyzed by a one-way ANOVA with Dunnett’s test. b, Heatmap depicting the genome-wide co-localization between MPP8 and H3K9me3, but not H3K4me3, ChIP-seq signals in MOLM-13 cells. MPP8 occupied genome regions (N = 6,292 peaks) were ranked according to the normalized MPP8 ChIP-seq intensities, and the regions upstream (−5kb) and downstream (+5kb) of the ChIP-seq peak summit are shown. Independent ChIP-seq experiments were merged for the heatmap illustration. c, Browser view of representative loci showing enrichment of MPP8 and H3K9me3 ChIP-seq signals at L1s. d, Validation of MPP8 chromatin occupancy at L1Hs in MOLM-13 cells and four independent primary AML samples (AML1 to AML4). Primers for the β-actin locus was analyzed as the negative control. Results are mean ± SD (N = 4 experiments) and analyzed by a two-way ANOVA with Bonferroni’s test. e, Depletion of MPP8 reactivated L1s in MOLM-13 cells, human normal CD34+ HSPCs and primary AML samples. Fold changes of L1 expression were calculated in MPP8-depleted versus shLuc-transduced cells. Results are mean ± SD (N = 4 experiments) and analyzed by a two-way ANOVA with Dunnett’s test. f, MPP8 KO in AML cells increased L1 retrotransposition, which were inhibited by 10 µM of 3TC. Representative flow cytometry graphs are shown for control (sgNT) or MPP8 KO (MPP8-sg1 and MPP8-sg2) cells harboring the LRE3-EGFP retrotransposition reporter or the retrotransposition-deficient JM111 control, respectively. g, Lower L1Hs expression is associated with poor survival in AML patients. Univariate and multivariate Cox regression analyses were performed using the AML samples from the TCGA cohort (N = 134 samples). L1Hs-high (top 50%) and L1Hs-low (bottom 50%) samples were compared. P values by the two-sided Wald test.
