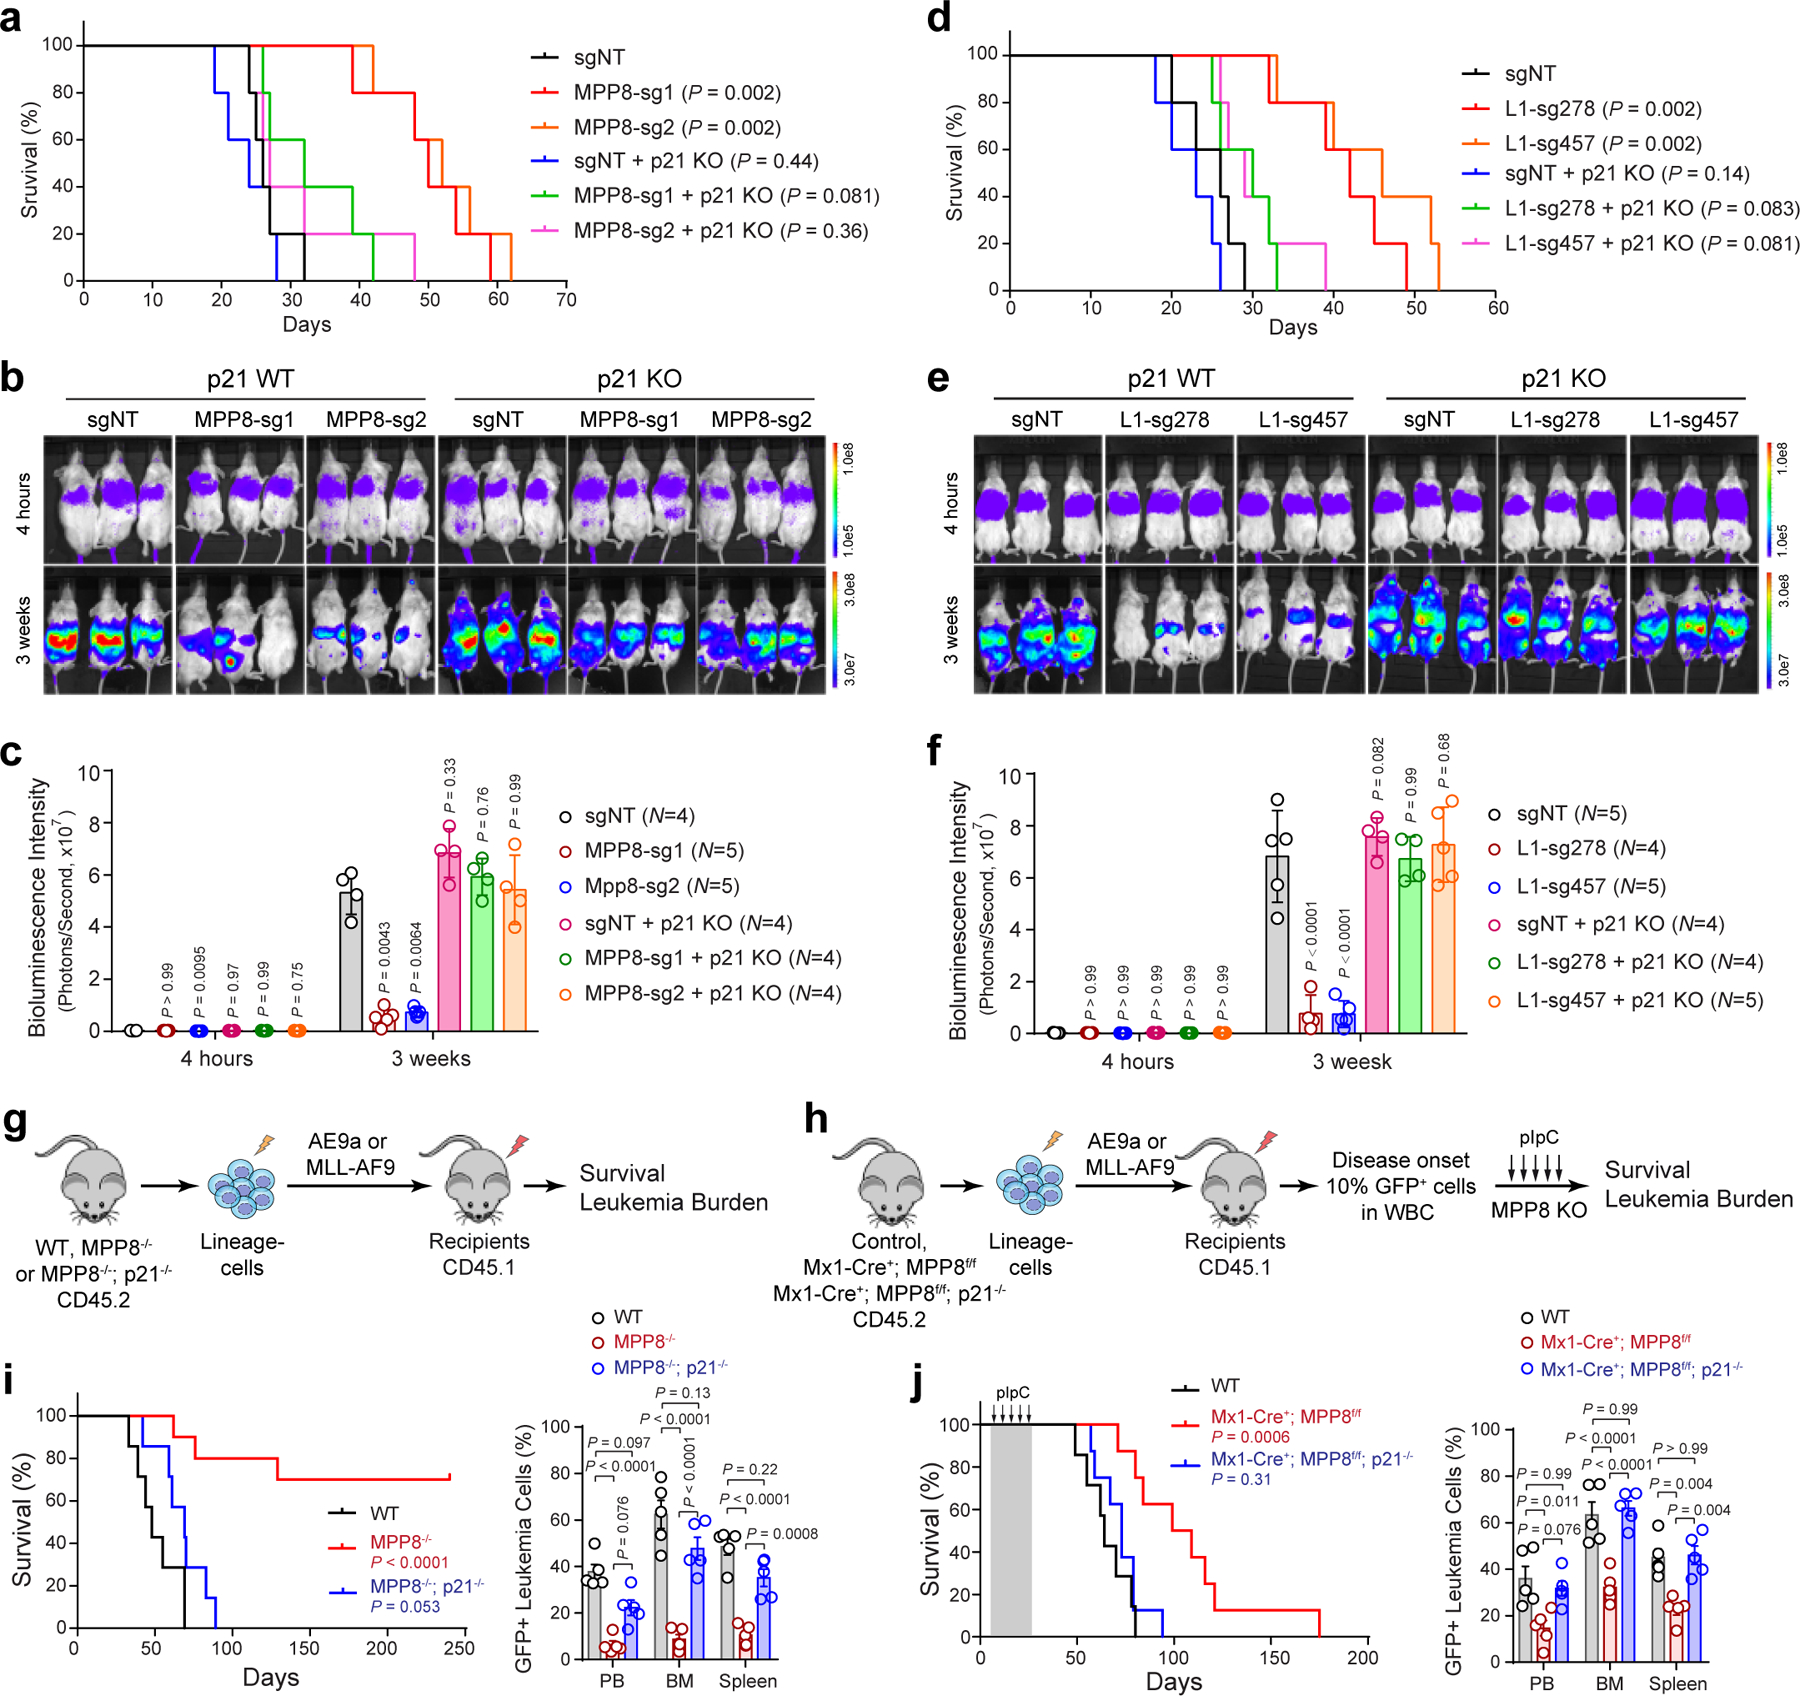
Extended Data Figure 9 |. p21 KO abrogates MPP8 KO or L1 reactivation-induced phenotypes in AML cells in vivo.

a, Survival curves of NSG mice xenografted with WT or p21 KO MOLM-13 cells transduced with control (sgNT) or MPP8-targeting sgRNAs. P values by a log-rank Mantel-Cox test. b, KO of p21 abrogated MPP8-deficiency-induced cell growth defects of MOLM-13 cells in NSG mice. Bioluminescence intensity is shown at 4 hours and 3 weeks post-transplantation. c, Quantification of bioluminescent imaging. The numbers of independent mice are indicated. Results are mean ± SD and analyzed by mixed-effects analysis with Dunnett’s test. d, Survival curves of NSG mice xenografted with WT or p21 KO MOLM-13 cells transduced with control or L1-promoter-targeting sgRNAs for CRISPRa-mediated L1 reactivation. P values by a log-rank Mantel-Cox test. e, KO of p21 abrogated L1-reactivation-induced cell growth defects of MOLM-13 cells in xenografted NSG mice. f, Quantification of bioluminescent imaging. The numbers of independent mice are indicated. Results are mean ± SD and analyzed by mixed-effects analysis with Dunnett’s test. g, Schematic of the leukemia initiation experiments. h, Schematic of the leukemia maintenance experiments. i, Survival curves of recipient mice engrafted with WT (N = 7 mice), MPP8−/− (N = 10), or MPP8−/−p21−/− (N = 7) BM lineage-negative cells transduced with MLL-AF9. P values by a log-rank Mantel-Cox test. Quantification of leukemia burden by % of GFP+ leukemia cells at day 38 post-transplantation is shown. Results are mean ± SEM and analyzed by a two-way ANOVA with Tukey’s test. j, Survival curves of recipient mice engrafted with cells of the indicated genotypes transduced with MLL-AF9 for the leukemia maintenance experiments. N = 7, 8, and 8 WT, Mx1-Cre+;MPP8f/f, and Mx1-Cre+;MPP8f/f;p21−/− mice, respectively. P values by a log-rank Mantel-Cox test. Quantification of leukemia burden at day 60 post-transplantation is shown. Results are mean ± SEM and analyzed by a two-way ANOVA with Tukey’s test.
