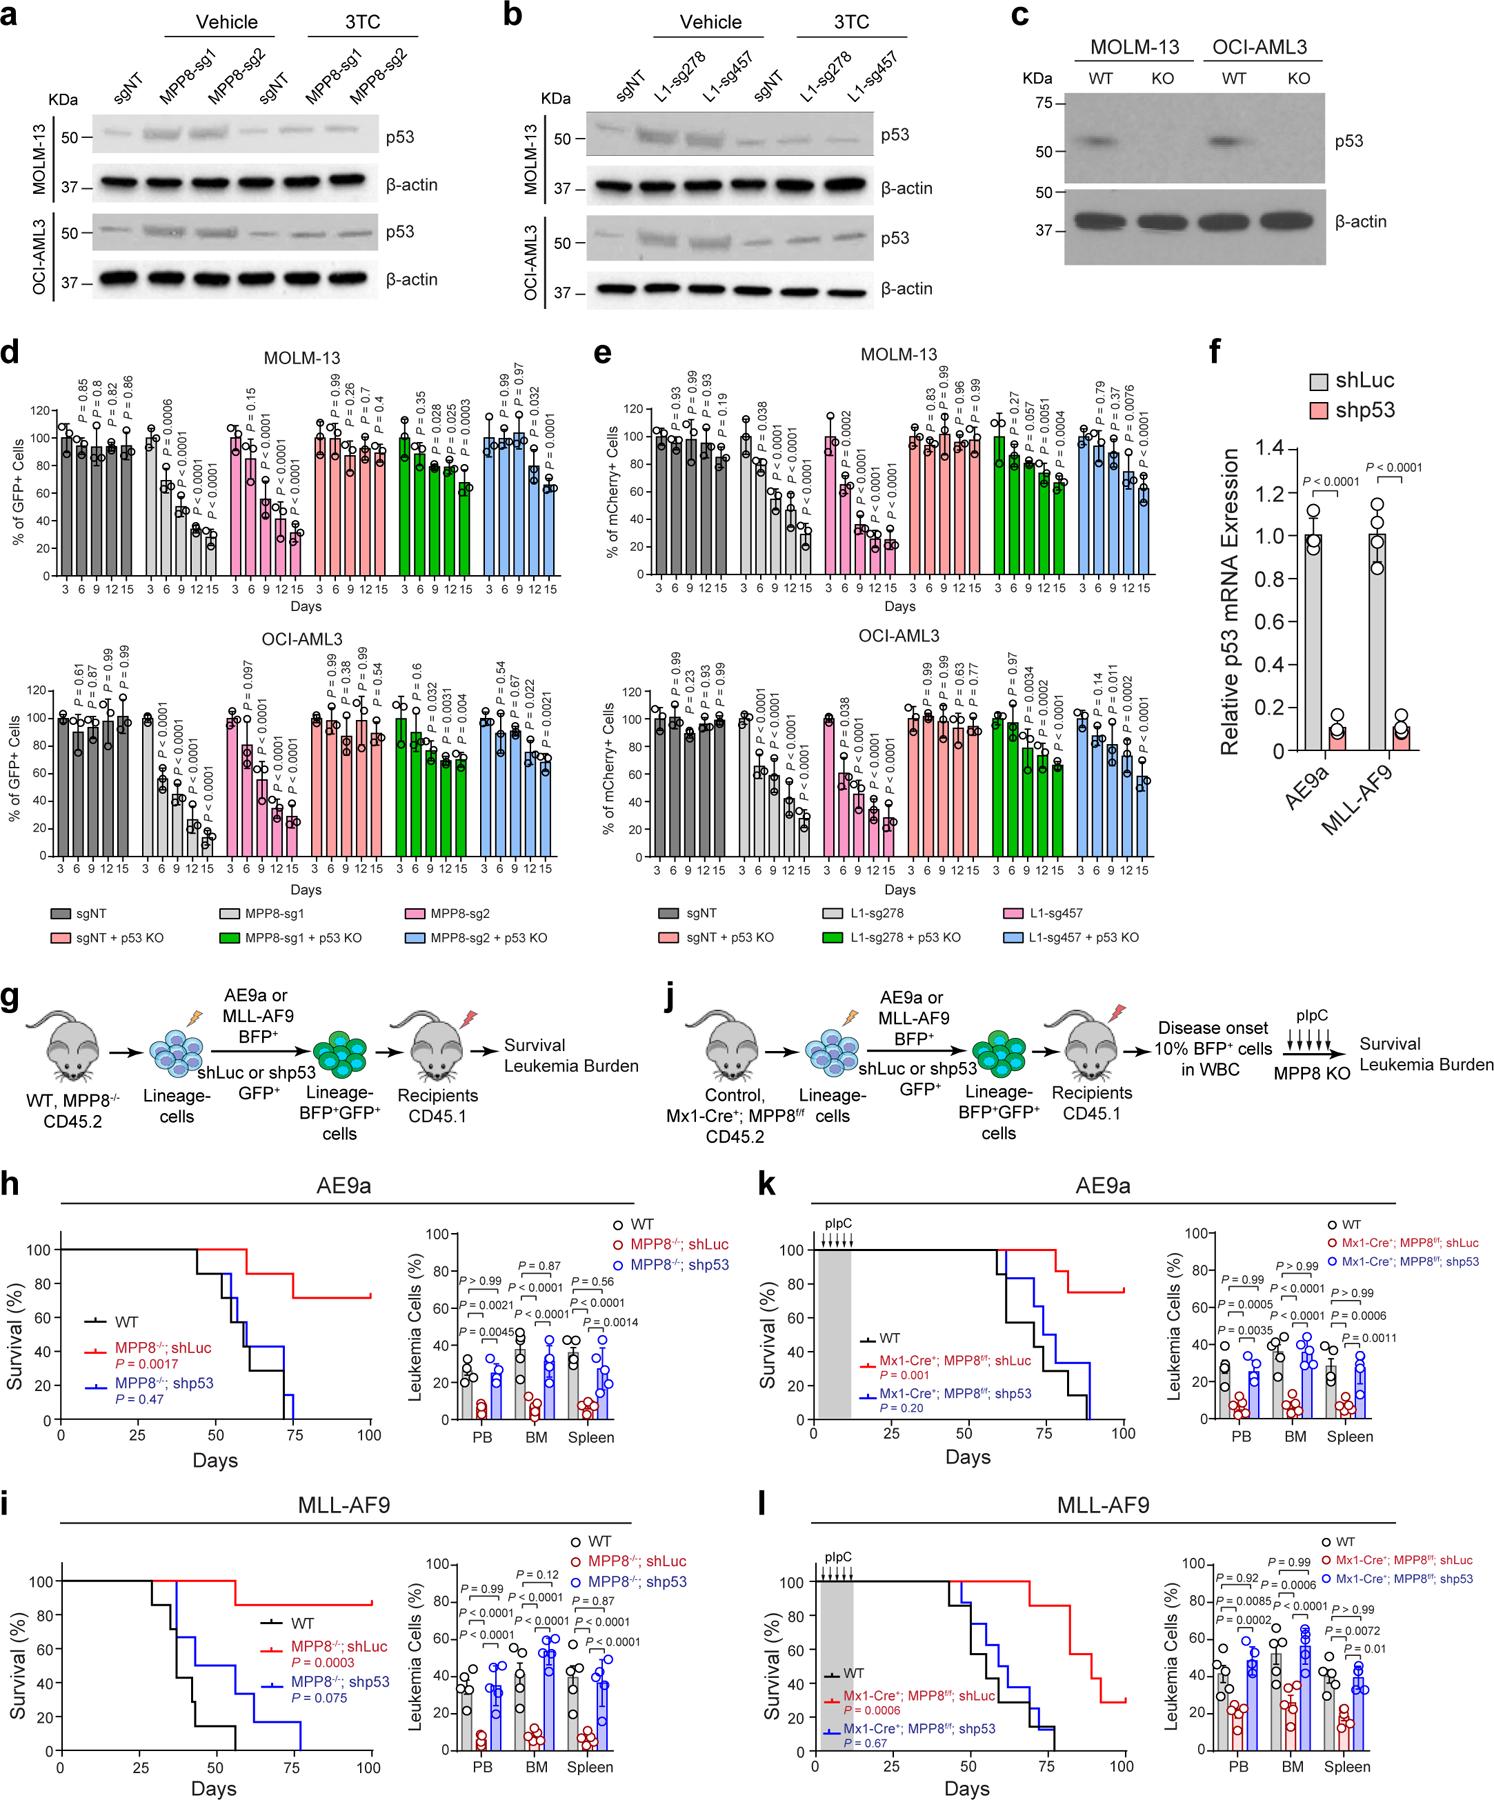
Extended Data Figure 10 |. p53 is required for MPP8 KO or L1 reactivation-induced phenotypes in AML cells.

a, MPP8 loss increased p53 expression in AML cells. b, L1 reactivation increased p53 expression in AML cells. c, Validation of p53 KO by Western blot. d, p53 KO blunted MPP8-deficiency-induced cell growth defects. Results are mean ± SD (N = 3 experiments) and analyzed by a two-way ANOVA with Dunnett’s test. e, p53 KO blunted L1-reactivation-induced cell growth defects. Results are mean ± SD (N = 3 independent experiments) and analyzed by a two-way ANOVA with Dunnett’s test. f, Validation of p53 depletion in AE9a or MLL-AF9-transformed BM cells. Results are mean ± SD (N = 4 experiments) and analyzed by a two-way ANOVA with Bonferroni’s test. g, Schematic of the leukemia initiation experiments. h, Survival curves of recipients engrafted with AE9a-transformed WT or MPP8−/− cells with control (shLuc) or p53 depletion. N = 7 mice. P values by a log-rank Mantel-Cox test. Quantification of leukemia burden at day 50 post-transplantation (N = 5 mice) is shown. i, Survival curves of recipients engrafted with MLL-AF9-transformed WT or MPP8−/− cells with or without p53 depletion. N = 7, 7, and 6 mice for WT, MPP8−/−;shLuc, and MPP8−/−;shp53, respectively. Quantification of leukemia burden at day 37 (N = 5 mice) is shown. j, Schematic of the leukemia maintenance experiments. k, Survival curves of recipients engrafted with AE9a-transformed cells. N = 7, 8, and 6 mice for WT, Mx1-Cre+;MPP8f/f;shLuc, and Mx1-Cre+;MPP8f/f;shp53, respectively. Quantification of leukemia burden at day 62 (N = 5 mice) is shown. l, Survival curves of recipients engrafted with MLL-AF9-transformed cells. N = 7, 7, and 8 mice for WT, Mx1-Cre+;MPP8f/f;shLuc, and Mx1-Cre+;MPP8f/f;shp53, respectively. Quantification of leukemia burden at day 47 (N = 5 mice) is shown. For h, i, k and l, results are mean ± SD and analyzed by a two-way ANOVA with Tukey’s test.
