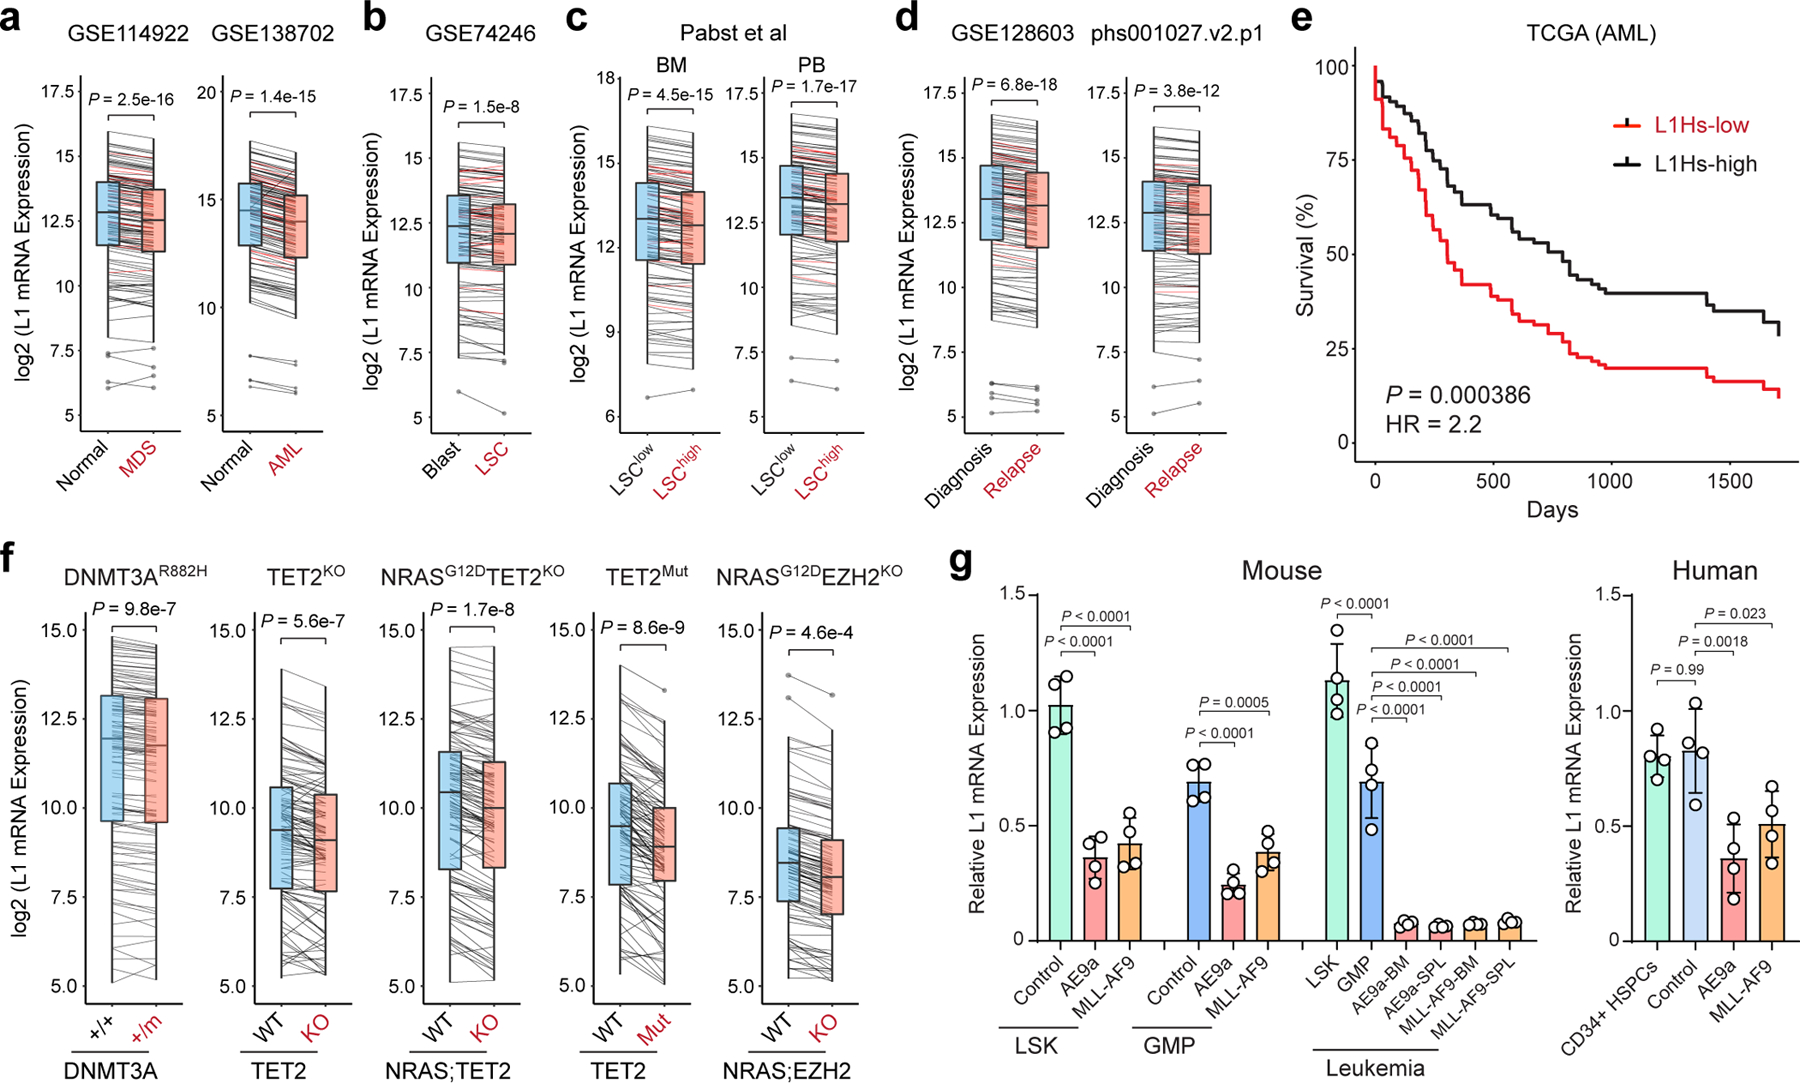
Figure 4 |. Silencing of LINE-1 retrotransposons in myeloid leukemia.

a, Expression of L1Hs (red lines) and other L1s (black lines) was downregulated in human CD34+ MDS and AML cells relative to normal CD34+ HSPCs. y-axis shows the log2 normalized mRNA expression (read counts) of annotated L1s. P value by a two-sided paired t test (N = 131 annotated L1s in 8 normal and 82 MDS, or 10 normal and 9 AML samples). Boxes show median of data and quartiles, and whiskers extend to 1.5× of interquartile range. b, Expression of L1Hs and other L1s was downregulated in human CD34+CD38− AML LSCs relative to blasts. P value by a two-sided paired t test (N = 131 L1s in 8 LSCs and 8 blasts). c, L1s were downregulated in LSChigh relative to LSClow AML samples. Samples derived from BM or PB were grouped. P values by a two-sided paired t test (N = 131 L1s in 13 LSClow and 3 LSChigh BM samples, or 5 LSClow and 3 LSChigh PB samples). d, L1s were downregulated in relapsed relative to diagnosis AML samples. P values by a two-sided paired t test (N = 131 L1s in 10 diagnosis and 10 relapse samples in GSE128603, or 19 diagnosis and 19 relapse samples in phs001027.v2.p1). e, Lower L1 expression is associated with poor survival in TCGA AML cohorts (N = 134 samples). L1Hs-high (top 50%) and L1Hs-low (bottom 50%) samples were compared. P value by a log-rank Mantel-Cox test. f, L1s were downregulated by AML oncogenes in LSK cells. P values by a paired t test (N = 2 DNMT3A+/+ and 4 DNMT3A+/m, 2 TET2 WT and 2 KO, 2 TET2 WT and 2 mutant, 3 WT and 3 NRASG12DTET2KO, or 3 WT and 4 NRASG12DEZH2KO). g, L1s were downregulated by AE9a or MLL-AF9 in LSK or GMP cells, and further downregulated in transplanted recipient mouse BM or spleen (SPL). L1s were also downregulated in human CD34+ HSPCs upon expression of AE9a or MLL-AF9 relative to empty vector (control) or un-transduced cells. Results are mean ± SD (N = 4 experiments) and analyzed by a one-way ANOVA with Dunnett’s or Tukey’s test.
