
Figure 5 |. Reactivation of L1 retrotransposition impairs AML in vitro and in vivo.
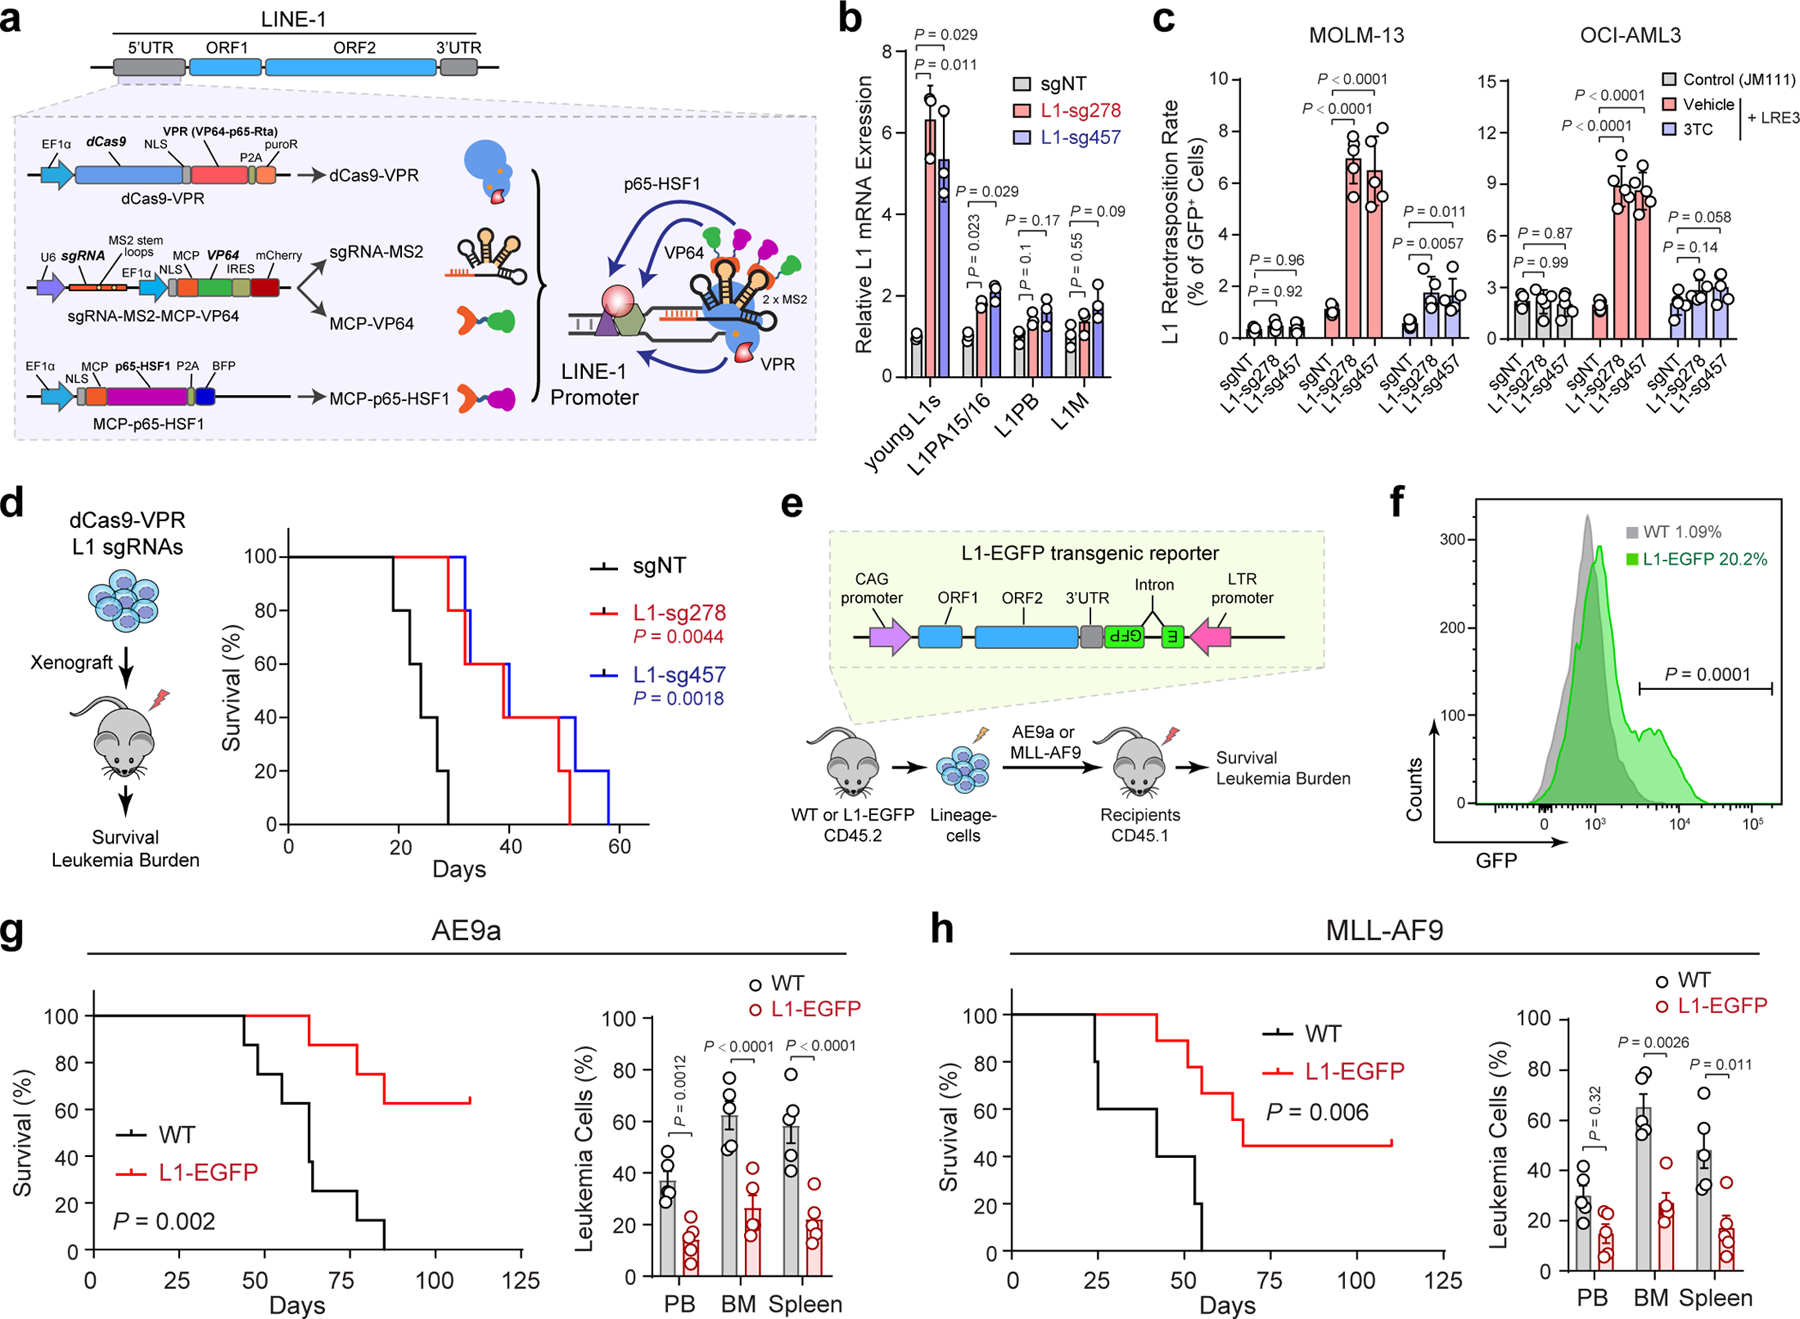
a, Schematic of CRISPR-mediated activation (CRISPRa) of endogenous L1s. sgRNAs were designed against the promoter (5’UTR) region of L1Hs. b, Expression of young L1s was upregulated in MOLM-13 cells upon CRISPRa-mediated activation by multiplexed targeting of L1 promoters with the triple-sgRNA combinations (sg278 or sg457). Results are mean ± SD (N = 3 independent experiments) and analyzed by a two-way ANOVA with Dunnett’s test. c, L1 retrotransposition rates were determined in MOLM-13 and OCI-AML3 cells upon CRISPRa-mediated L1 activation. 3TC treatment (10 µM) abrogated L1 retrotransposition. Cells stably expressing the retrotransposition-deficient JM111 reporter were analyzed as controls. Results are mean ± SD (N = 5 independent experiments) and analyzed by a two-way ANOVA with Dunnett’s test. d, Kaplan-Meier survival curves of NSG mice xenografted with control (sgNT) or L1-reactivated MOLM-13 cells. N = 5 per group. P values by a log-rank Mantel-Cox test. e, Schematic of activating L1 retrotransposition during leukemia development using the L1-EGFP transgenic mouse. f, Activated L1 retrotransposition as determined by GFP+ cells in BM lineage-negative cells of L1-EGFP mice. C57BL/6 WT mice were analyzed as controls. N = 4 WT and 4 L1-EGFP. P value by a two-sided t test. g, Kaplan-Meier survival curves of recipient mice upon transplantation of AE9a-transformed cells from WT or L1-EGFP mice. N = 8 WT and 8 L1-EGFP mice. P value by a log-rank Mantel-Cox test. Quantification of leukemia burden in PB, BM and spleen at day 60 is shown. Results are mean ± SD (N = 5 mice per genotype) and analyzed by a two-way ANOVA with Bonferroni’s test. h, Kaplan-Meier survival curves of recipient mice after transplantation of MLL-AF9-transformed cells. N = 5 WT and 9 L1-EGFP mice. P value by a log-rank Mantel-Cox test. Leukemia burden in PB, BM and spleen at day 38 post-transplantation is shown. Results are mean ± SD (N = 5 mice per genotype) and analyzed by a two-way ANOVA with Bonferroni’s test.