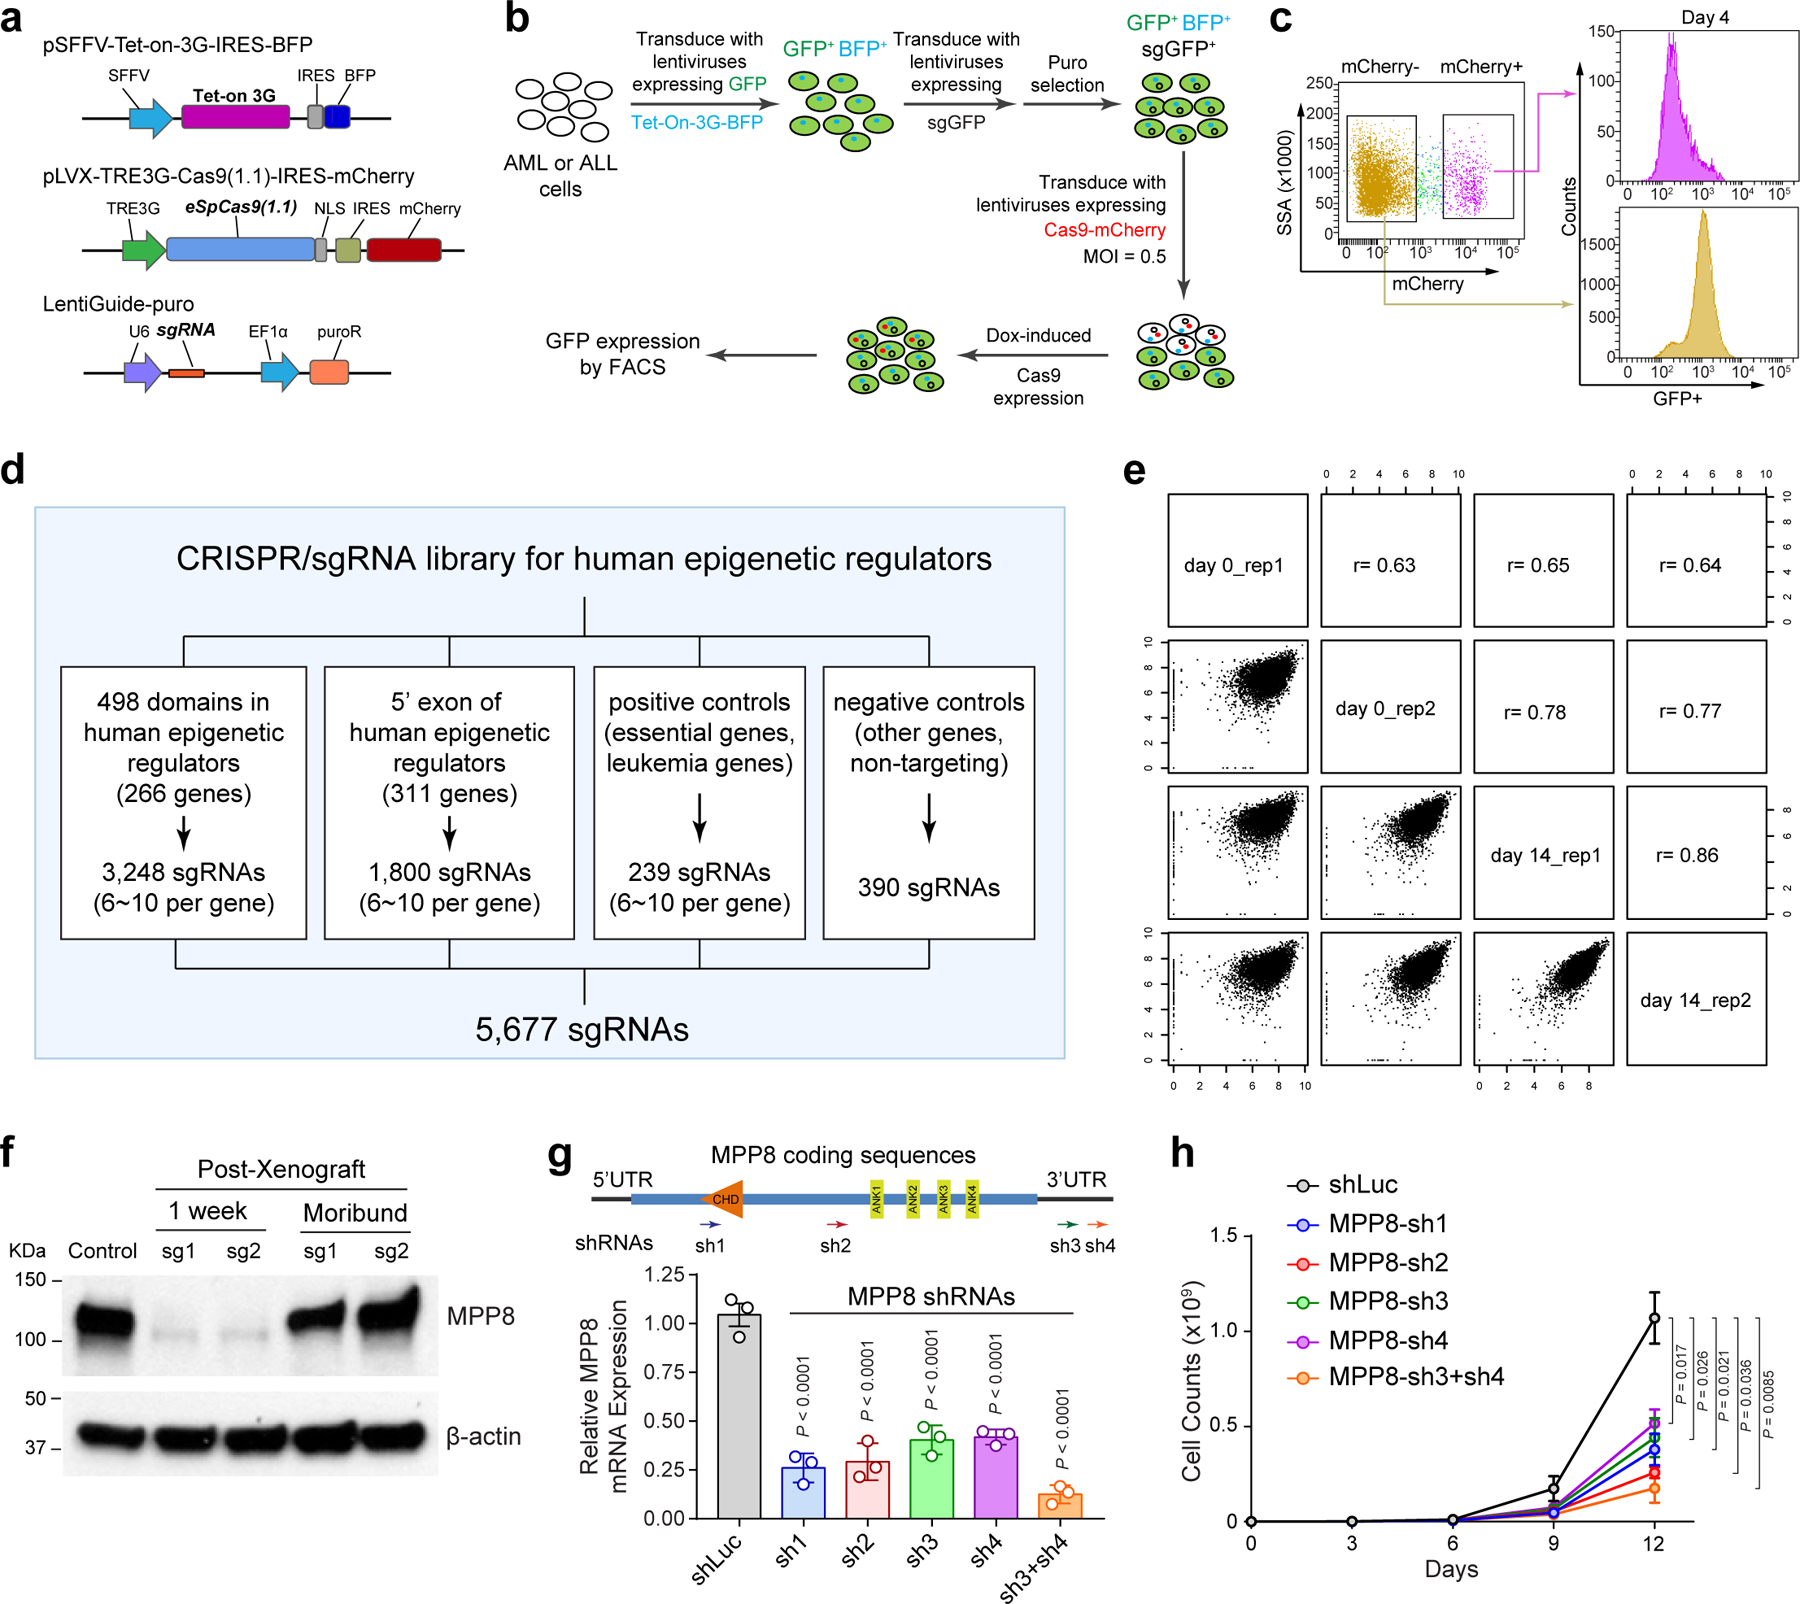
Extended Data Figure 1 |. Design and validation of epigenetic regulator-focused CRISPR screens.

a, Schematic of the CRISPR screen system containing a TET-on-3G trans-activator, a tetracycline (TRE3G)-inducible Cas9 with an mCherry reporter, and the sgRNA. b, Schematic of the experiments to validate the inducible CRISPR screen system by targeting the stably expressed GFP reporter gene in MOLM-13 cells. c, Dox-induced expression of Cas9 and GFP-targeting sgRNAs in mCherry+ cells significantly decreased GFP expression compared to Cas9-negative (mCherry−) cells after 4 days of doxycycline treatment. d, Schematic of the customized sgRNA library containing 3,248 sgRNAs targeting 498 conserved chromatin-interacting domains in 266 annotated human epigenetic regulators and 1,800 sgRNAs targeting the 5’ exon of the other epigenetic regulators, together with 239 positive and 390 negative control sgRNAs. e, Comparisons of replicate experiments of CRISPR screens in MOLM-13 cells. The x- and y-axis of each graph represent the normalized sgRNA counts at day0 and day14. Spearman correlation value is shown for each comparison. f, MPP8 expression was determined by Western blot in MOLM-13 cells before xenograft (control), one week after Dox-induced MPP8 KO in xenografted NSG mice, and in the moribund mice (6-week post-xenograft) by independent MPP8-targeting sgRNAs (sg1 and sg2). g, Depletion of MPP8 by RNAi-mediated knockdown using shRNAs against the coding or 3’UTR sequences. shRNA against the luciferase gene (shLuc) was used as a negative control. Schematic of the MPP8 gene and the positions of shRNAs (sh1 to sh4) are shown. Results are mean ± SD (N = 3 independent experiments) and analyzed by a one-way ANOVA with Dunnett’s test. h, Growth curves of MOLM-13 AML cells after doxycycline-induced expression of MPP8-targeting shRNAs. Results are mean ± SD (N = 3 independent experiments) and analyzed by a two-way ANOVA with Tukey’s test.
