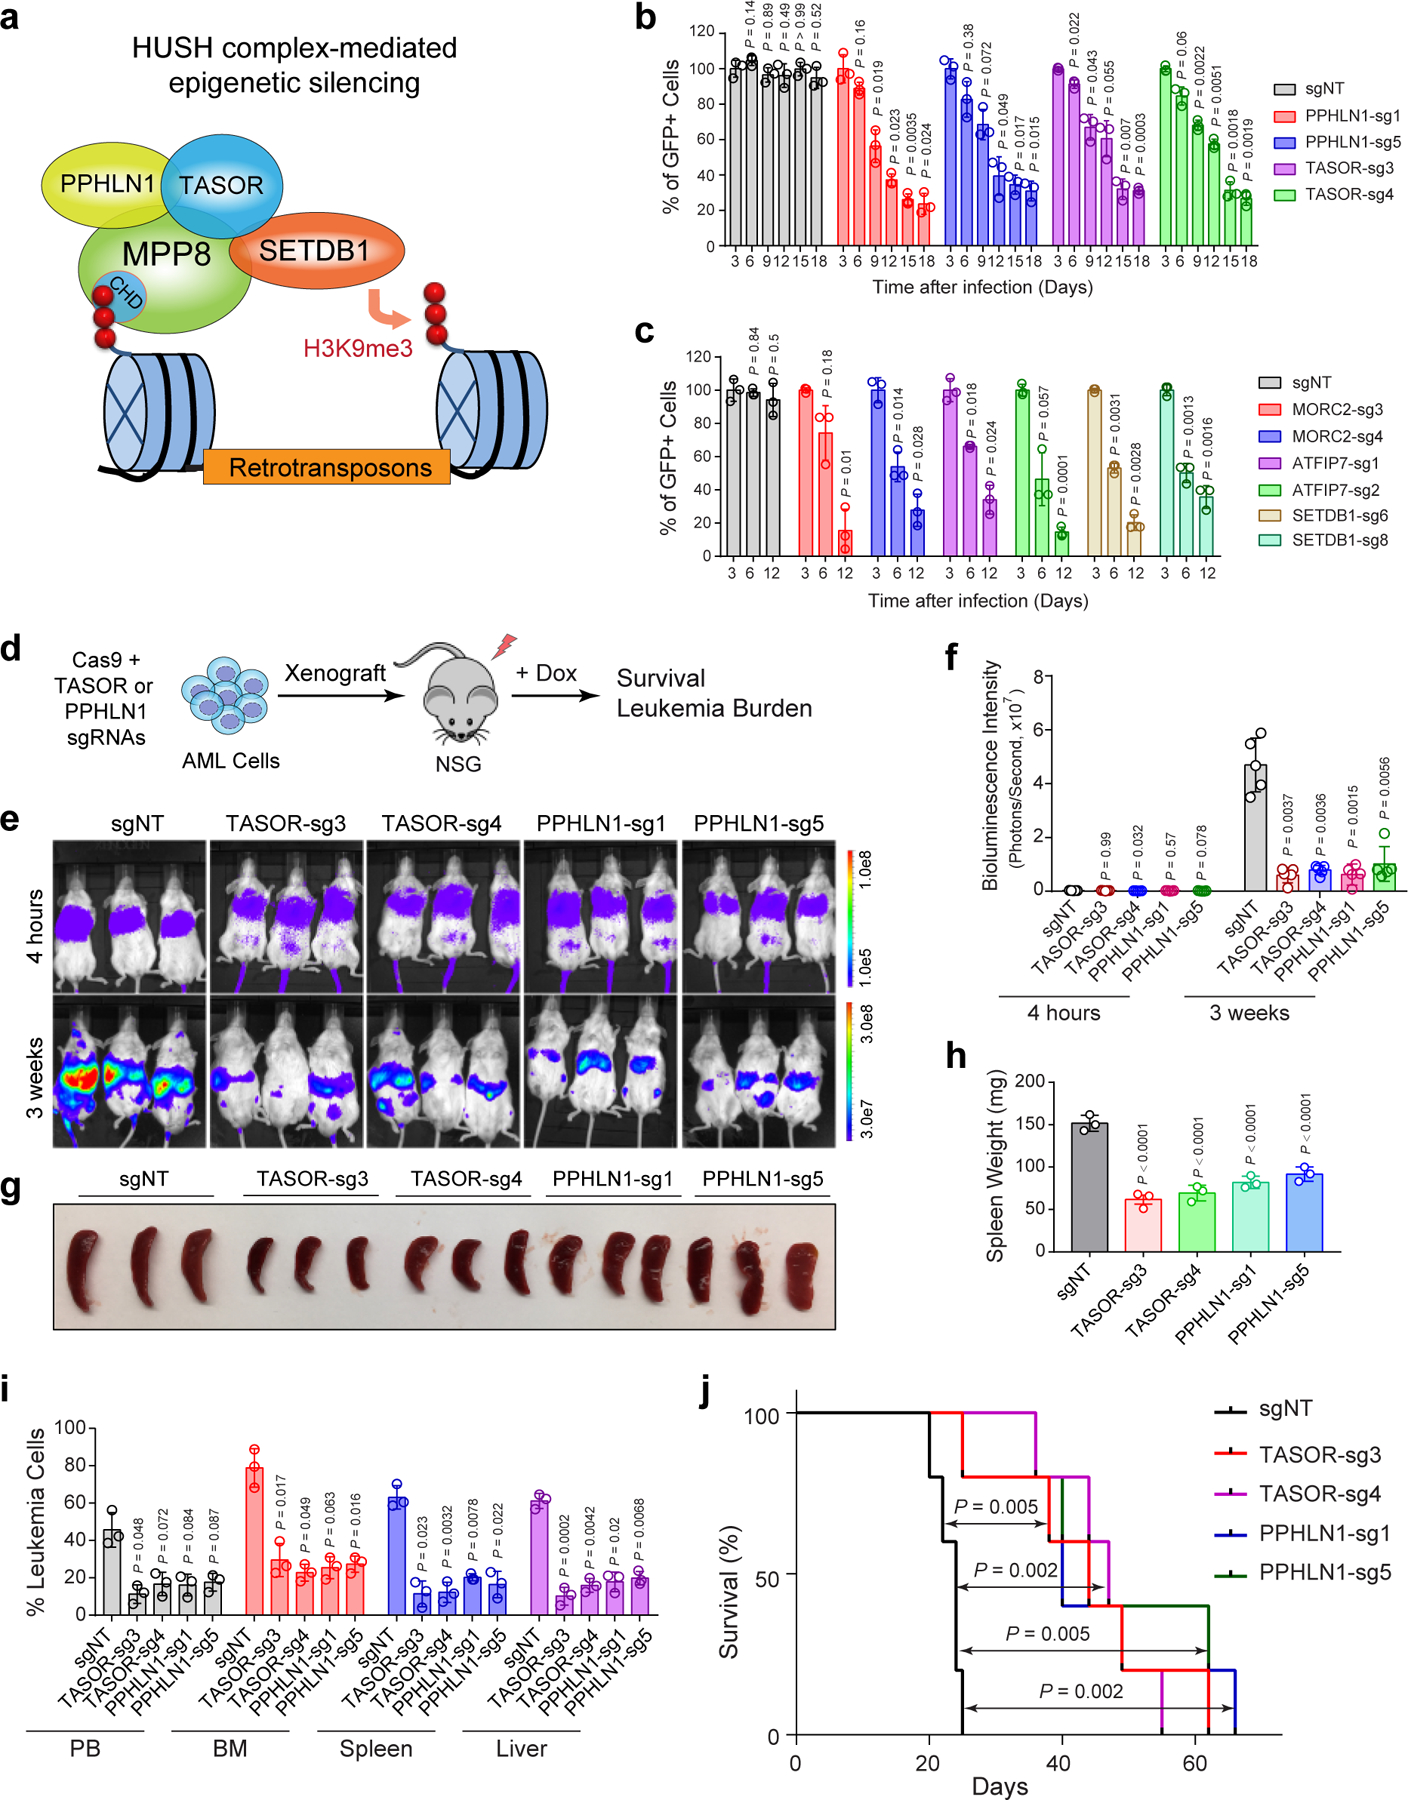
Extended Data Figure 2 |. HUSH components and other L1 regulators are required for myeloid leukemia cells.

a, Schematic of the HUSH complex in epigenetic silencing of retrotransposons. b, Depletion of HUSH proteins (PPHLN1 and TASOR) impaired MOLM-13 cell growth by the negative-selection competition assays. Results are mean ± SD (N = 3 independent experiments) and analyzed by a two-way ANOVA with Dunnett’s test. c, Depletion of other L1 regulators (MORC2, ATPIP7 and SETDB1) impaired MOLM-13 cell growth. Results are mean ± SD (N = 3 independent experiments) and analyzed by a two-way ANOVA with Dunnett’s test. d, Schematic of the xenotransplantation assay. e, Depletion of HUSH proteins (TASOR or PPHLN1) impaired MOLM-13 cell growth in NSG mice. Bioluminescence intensity is shown at 4 hours and 3 weeks post-transplantation. f, Quantification of bioluminescent imaging. Results are mean ± SD (N = 5 mice per group) and analyzed by a two-way ANOVA with Dunnett’s test. g, Representative image is shown for spleens of the xenografted NSG mice 3 weeks post-transplantation. h, Quantification of spleen weight 3 weeks post-transplantation. Results are mean ± SD (N = 3 mice per genotype) and analyzed by a one-way ANOVA with Dunnett’s test. i, Quantification of leukemia burden in PB, BM, spleen and liver of the xenografted NSG mice 3 weeks post-transplantation. Results are mean ± SD (N = 3 mice per group) and analyzed by a two-way ANOVA with Dunnett’s test. j, Kaplan-Meier survival curves of NSG mice xenografted with MOLM-13 cells transduced with control (sgNT) or sgRNAs against TASOR or PPHLN1. N = 5 mice per group. P values by a log-rank Mantel-Cox test.
