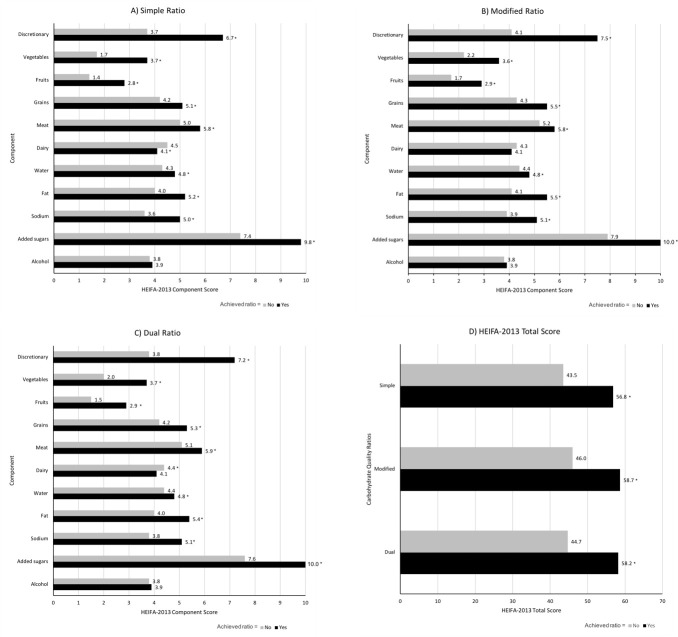
Fig 1. Healthy Eating Index for Australian adults (HEIFA-2013) 11 component scores and total score for adults in the 2011–2012 Australian National Nutrition and Physical Activity Survey (NNPAS) who achieved or did not achieve each carbohydrate quality ratio.
(A) Simple ratio (10:1), at least 1g of fiber per 10g of carbohydrates; (B) Modified ratio (10:1:2), at least 1g of fiber and no more than 2g of free sugars per 10g of carbohydrates; (C) Dual ratio (10:1 & 1:2), at least 1g of fiber per 10g of carbohydrates and no more than 2g of free sugars per 1g of fiber; and (D) HEIFA-2013 total scores. *** P<0.001 compared to adults who did not achieve the ratio, derived by independent samples t-tests.

