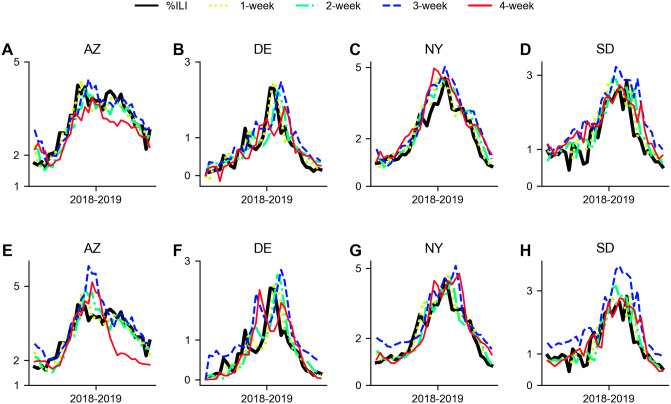
Fig 16. Example plots of %ILI in 4 states {AZ, DE, NY, SD} and predictions made by SNAIL and Seq2Seq for 2018–2019 (test).
A. Arizona—SNAIL, B. Delaware—SNAIL, C. New York—SNAIL, D. South Dakota—SNAIL, E. Arizona—Seq2Seq, F. Delaware—Seq2Seq, G. New York—Seq2Seq, H. South Dakota—Seq2Seq. The original %ILI is depicted in solid black lines and the {1, 2, 3, 4}-weeks ahead prediction results are depicted in dotted yellow-green lines, dash-dot light green lines, dashed blue lines, and solid red lines, respectively.

