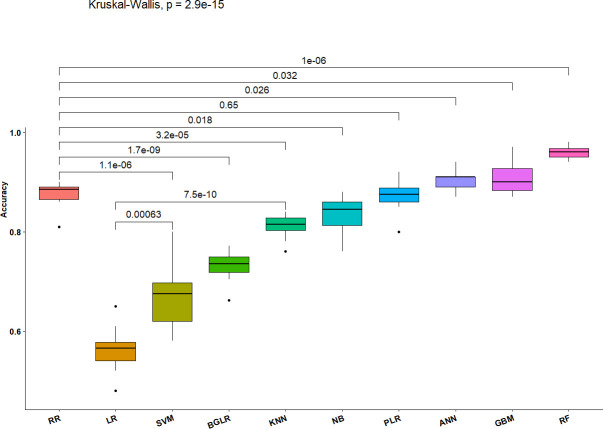
Fig 3. Boxplots of estimated decision accuracies from 10 replicates of 10-fold cross validations and significance of differences among ten GP methods based on Kruskal Wallace tests.
The horizontal lines inside each box represent the medians. Black dots represent outliers, and the numbers above connecting lines at the top of the graphic are the p-values for pairwise comparisons, while the value for the line that transcends all methods at the top of the figure is the overall p-value from the Kruskal-Wallis test for multiple comparisons of ranked decision accuracy values.

