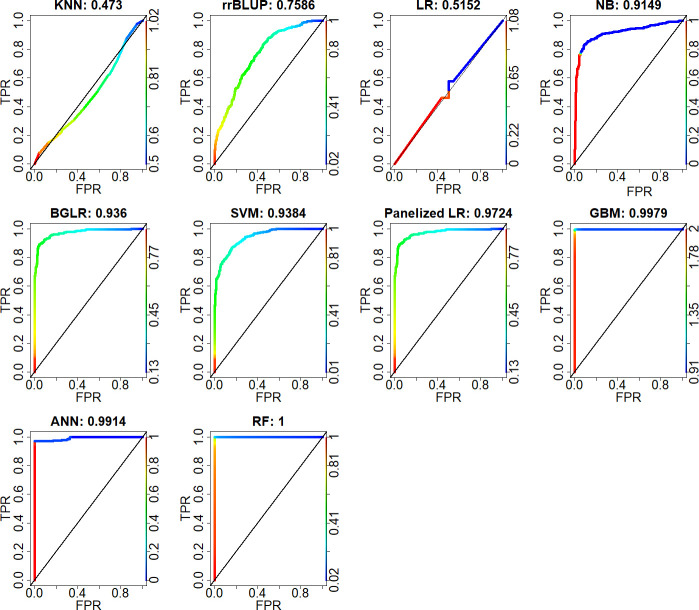
Fig 4. The area under the Receiver Operating Characteristic curve (AUC) from ten GP models.
The X-axis is the false positive rate (FPR), the y-axis is the true positive rate (TPR). At the top border of each image, the number after the colon is the AUC value. A 45-degree diagonal line of each AUC is interpreted as random classifications with equal frequencies of TPR and FPR.

