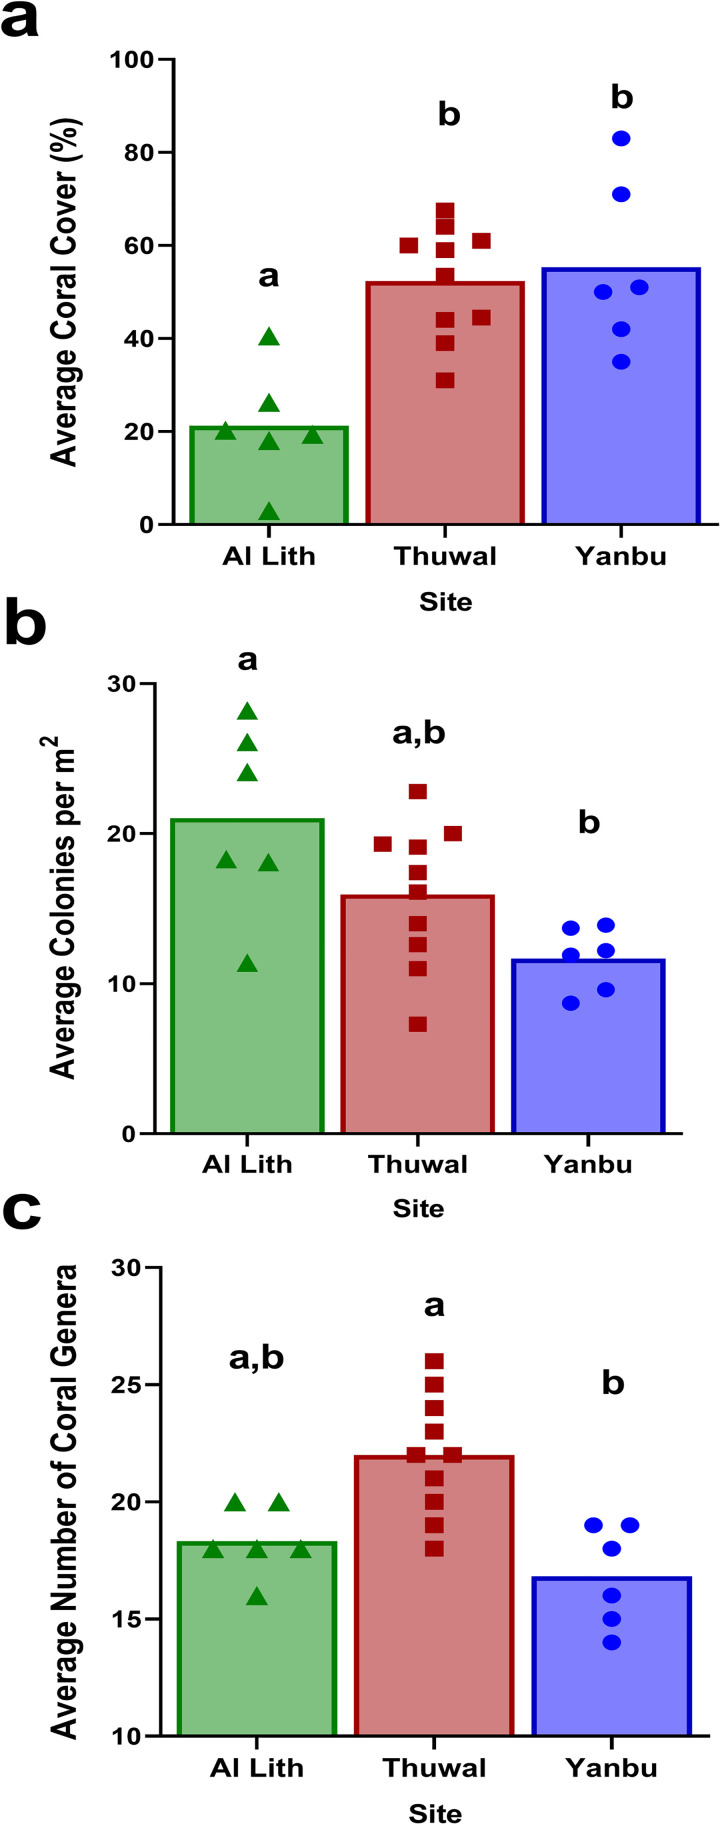
Fig 2.
Regional differences in coral cover (a), colony densities (b) and coral genus richness (c). Letters above bars indicate results of Dunn’s multiple group comparison tests. Symbols overlaying the bar graphs indicate the data points for all sites in each region. Six sites each were surveyed in Al Lith (triangles) and Yanbu (circles) and ten sites in Thuwal (squares).

