
Figure.
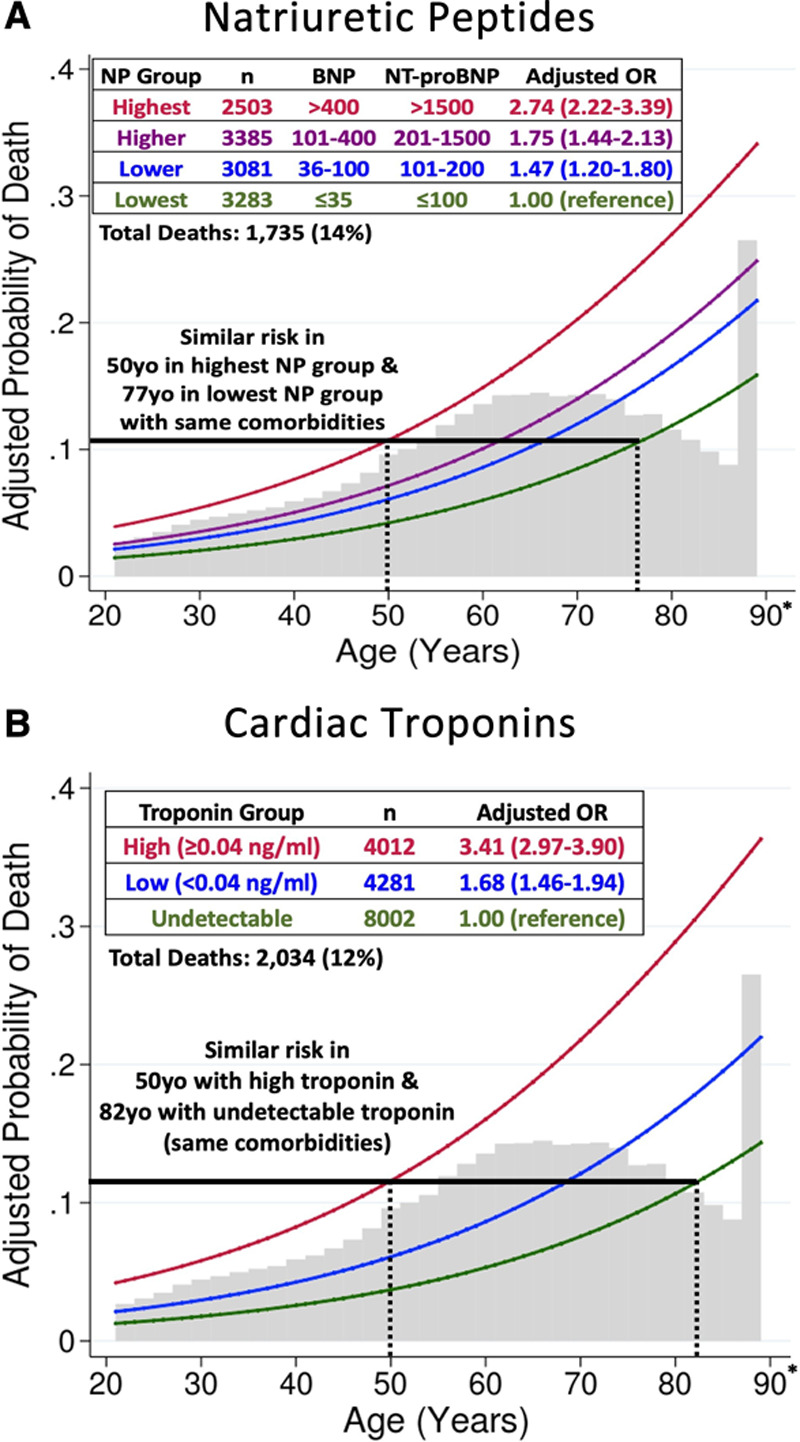
Adjusted probability of death, by age and biomarker level. A, Natriuretic peptides. B, Cardiac troponins. Curves represent estimated probability of death by multivariable logistic regression model including 18 covariates, with age as a linear predictor. Natriuretic peptide ranges are expressed in pg/mL. BNP indicates B-type natriuretic peptide; NP natriuretic peptide; NT-proBNP, N-terminal pro-B-type natriuretic peptide; and OR, odds ratio. *Patients ≥89 years of age (n=857 for NPs, n=1026 for troponin) are represented as 89 years in the dataset to preserve deidentification.