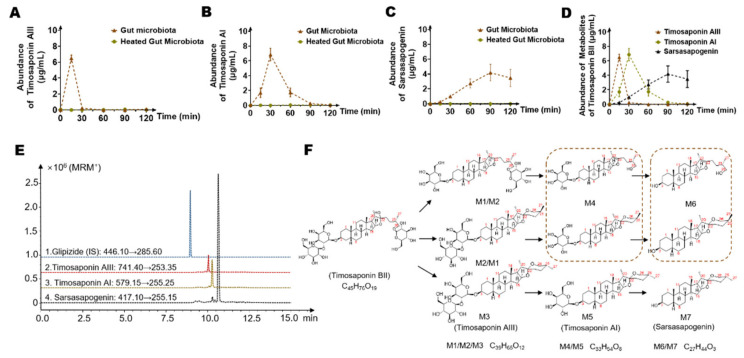
Figure 6.
The level of possible timosaponin BII metabolites changed during incubation with rat intestinal bacteria after 0 min, 15 min, 30 min, 60 min, 90 min, and 120 min. (A) Metabolic curve of timosaponin AIII. (B) Metabolic curve of timosaponin AI. (C) Metabolic curve of sarsasapogenin. (D) The temporal characteristics of potential timosaponin BII metabolites by gut microbiota. (E) Extracted ion chromatogram (EIC) spectra of timosaponin AIII, timosaponin AI, sarsasapogenin and the internal standard (Glipizide). (F) Metabolic pathway of timosaponin BII and possible structures of metabolites.

