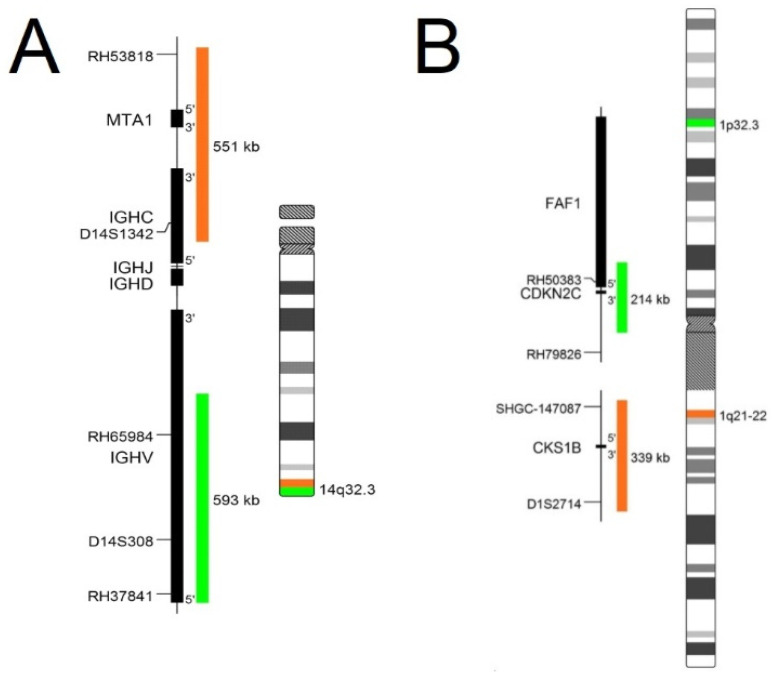
Figure 1.
Probe map of chromosome 14 and chromosome 1 with visualization of target genes, their sizes, and fluorescent dye used on visualization. (A) Map of break-apart probe of IGH gene capable of detected aberration: deletion, amplification, and breakage in gene; (B) Map of numerical probe on chromosome 1 able to detect only numerical changes: deletion and additions of material [17].

