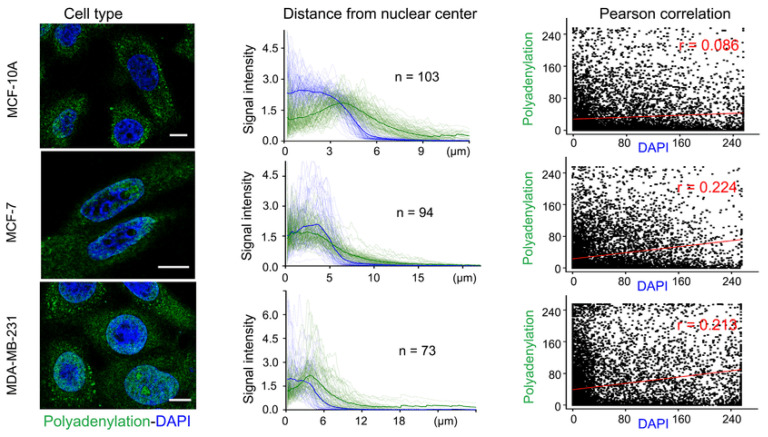
Figure 7.
Specific organization of RNA polyadenylation in specific cells. The pictures in the left column visualize three types of cells, in the cells is polyadenylation identified with green-fluorescent dye and DAPI with blue. The middle column shows signal intensity of DAPI and adenylation as a function for the distance of polyadenylation from the nuclear center, and in the right column is this distance interpreted by Person correlation [59].

