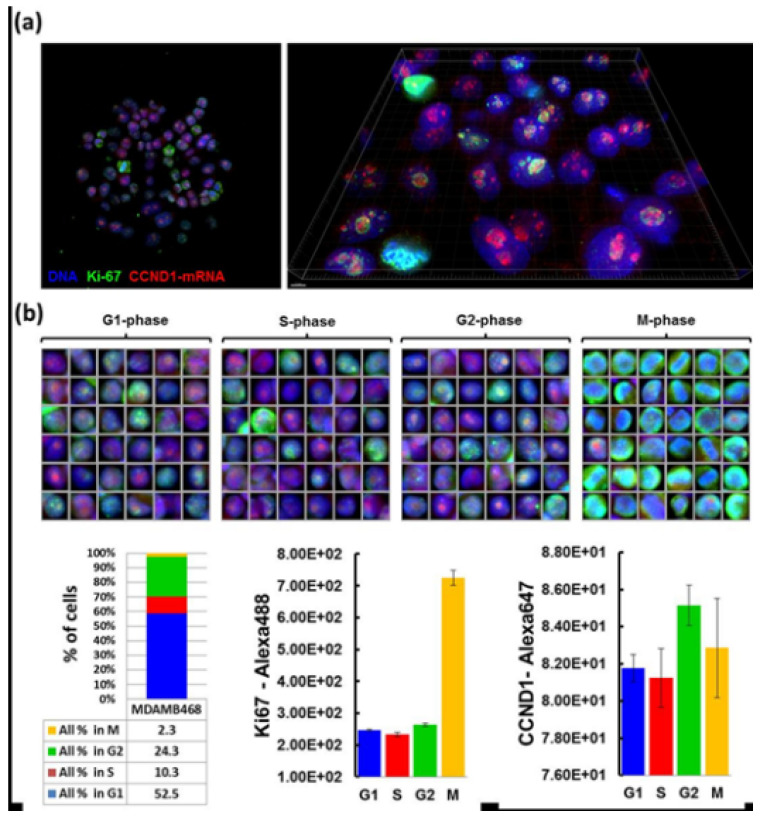
Figure 9.
Application of Quantitative RNA ISH on breast cancer cells. (a) shows the nuclei of breast cancer cells visualized with two fluorescent dyes—green with gene Ki-67 and red with gene CCND1. The nuclei are seen on the left at 20× magnification, and on the right at high resolution. (b) shows numerous pictures of nuclei with monitored genes in each phase of the cell cycle. The panel in the table at the bottom of the picture contains quantitative analysis of gene expression, showing that the majority of expressions in gene Ki-67 are observed in mitotic phase, while in gene CCND1 there are the highest number of expressions in the G2 phase of the cell cycle [67].

