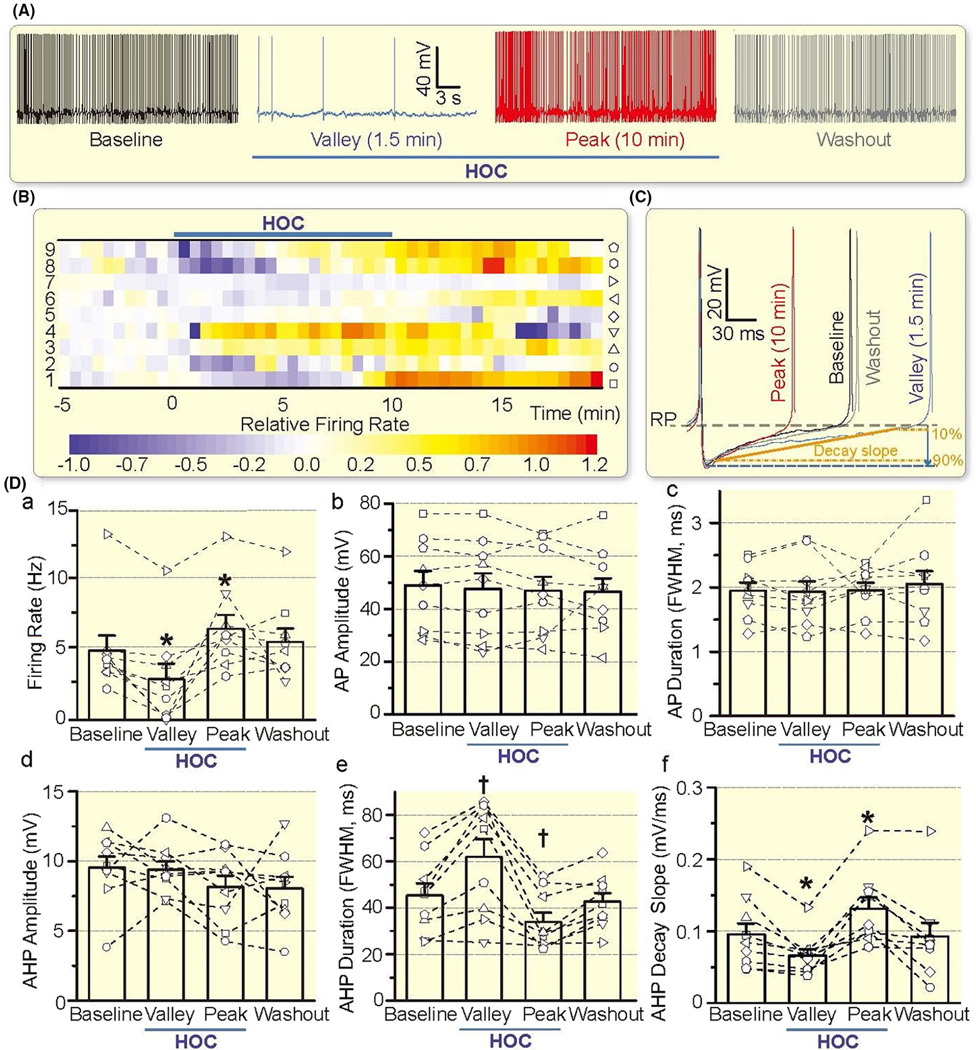
FIGURE 3.

HOC has dual effect on VP neuronal activity. A, Representative firing activity of a VP neuron (whole-cell patch-clamp recording) at control/baseline, 1.5 min and 10 min of HOC, and 10 min of washout, which correspond to the firing rate 1 min before HOC, the lowest firing rate (Valley), a rebound increase (Peak) of the firing rate during HOC and return to the baseline upon washout respectively. B, Heatmap of the relative firing rate showing the effect of HOC on the firing activity of VP neurons. Look-up table at the bottom indicates linear scale of relative firing rates, expressed as (f − f0)/f0, where f0 was the baseline firing rate. Symbols associated with individual VP neurons (numbered on the left) are shown in the vertical to the right. C, Representative action potentials/spikes at different stages of HOC; the resting membrane potential (RP) is indicated by the purple horizontal dashed line. Decay slope of AHP is defined based on 90% and 10% values (between solid and dashed lines in orange) of the AHP peak amplitude, the latter indicted by blue arrow and horizontal dashed line. D, Bar graphs illustrating the effect of HOC on the firing rate (a), action potential (AP) amplitude (b) and duration (c; expressed as FWHM), and afterhyperpolarization (AHP) amplitude (d), duration (e) and decay slope (f). *P < .05 and †P < .01 compared with baseline value before HOC treatment by Bonferroni test
