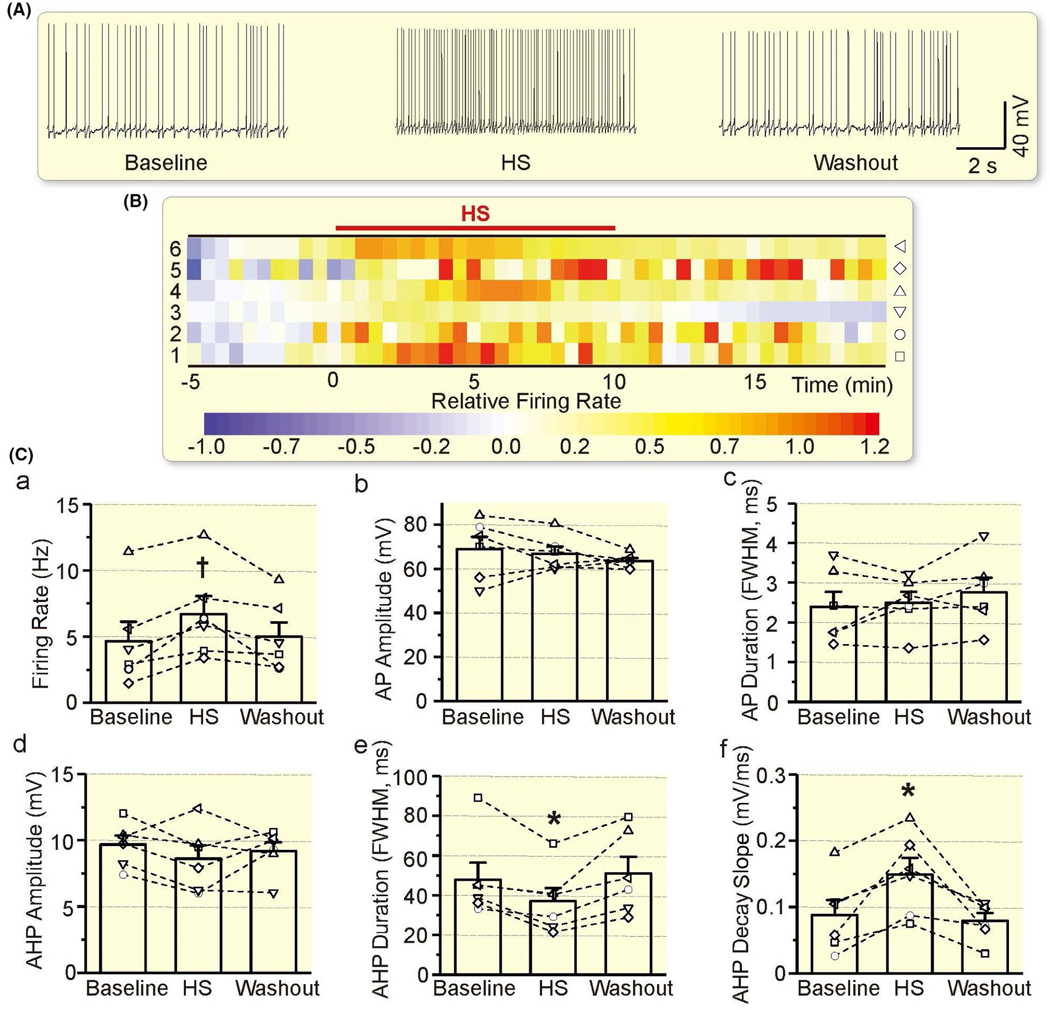
FIGURE 6.

Effects of hyperosmotic stress (HS) on the electrical activity of VP neurons. A-C, Representative episodes (A), heatmap of the relative firing rate (B) and summarizing bar graphs (C) of the electrical activity of VP neurons in patch-clamp recording, taken at 1 min before HS, 10 min after HS and washout for 10 min respectively. Other annotations refer to Figures 3 and 5
