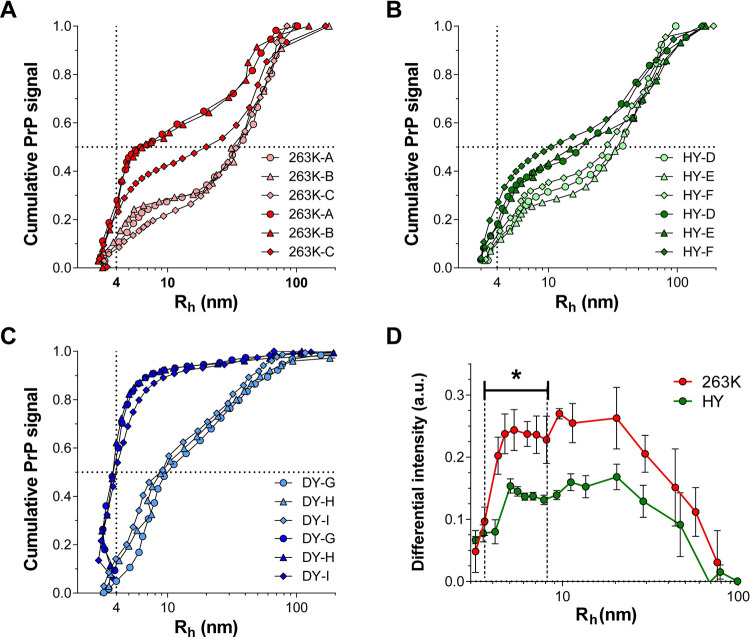
Fig 4.
Cumulative PrP signal as a function of particle size for 263K (A), HY (B), and DY (C) fractionated in the absence (light symbols) or in the presence (dark symbols) of SDS micelles. Circles, triangles, and rhombus represent data obtained from three different BHs (indicated by the letters A-I). Vertical and horizontal dotted lines intersect at 4 nm Rh and 50% of the cumulated PrP signal, respectively. D) Subtraction of the cumulative size distribution curves in the presence and absence of SDS micelles for 263K (red) and HY (green). Error bars represent SE; p-value * ≤ 0.05.

