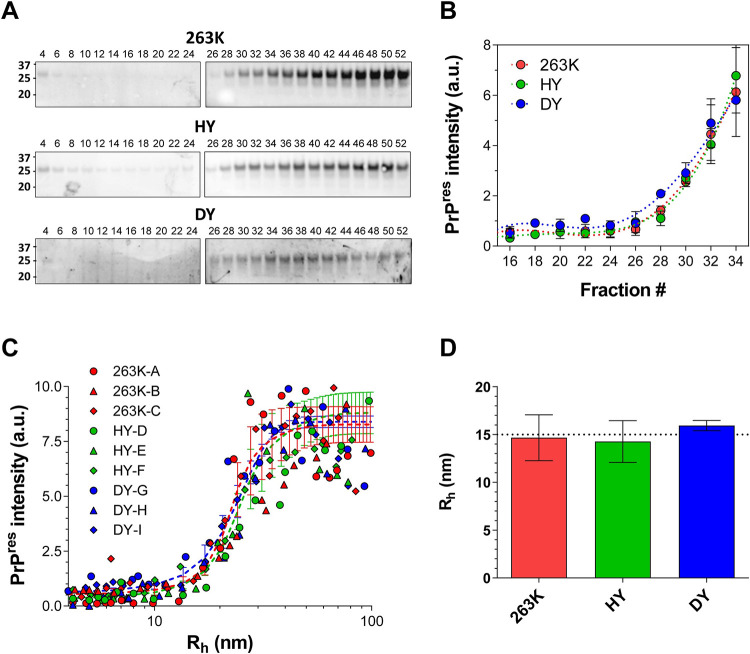
Fig 5.
A) Representative immunoblot for PrPres from 263K, HY, and DY AF4 fractions; fractions from each brain homogenate sample were treated with PK and loaded in two polyacrylamide gels (gel 1: fraction 4 to 24, gel 2: fraction 26 to 52). B) Quantification of PrPres signal from 263K (red), HY (green), and DY (blue) AF4 fractions; (average ± SE). C) Size distributions of PrPres particles from 263K (red), HY (green) and DY (blue). Circles, triangles, and rhombus represent data from the three BH analyzed for each strain. Each set of data was fitted to a sigmoidal curve and the average of the curves is shown as a dashed line for each strain. D) Average size of the smallest PrP particle with increased PrPres signal. Error bars represent SE.

