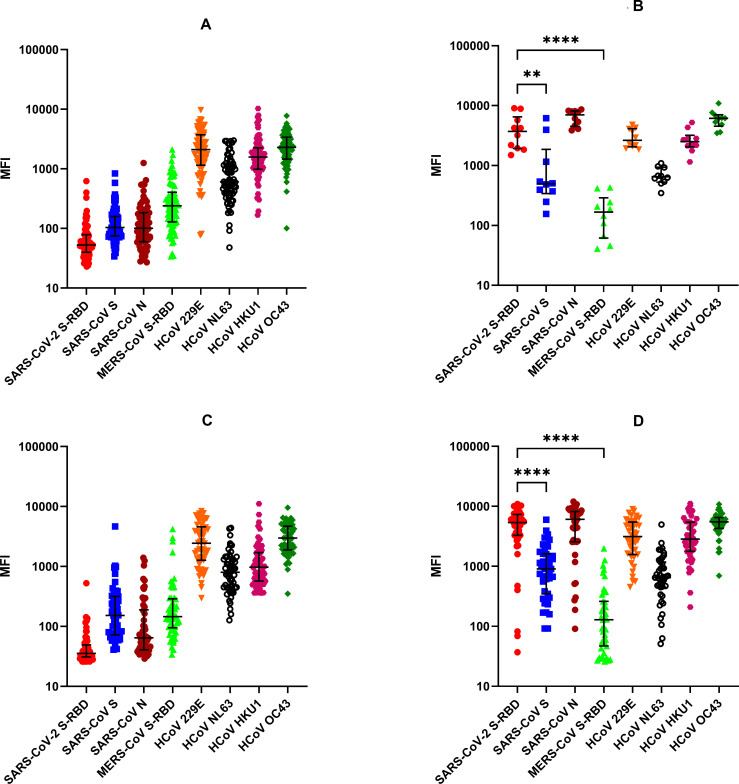
Fig 4. Total IgG levels detected by the multiplex antibody test against SARS-CoV-2 S-RBD, SARS-CoV S & N, MERS-CoV S-RBD and HCoVs.
MFI values in log10 scale and IQR are shown, and the P values by one-way ANOVA and Tukey’s multiple comparison test between the groups are as follows: ** p<0.001, **** p<0.0001. (A) Healthy Controls from USA, (B) COVID-19 Patients from USA, (C) Healthy Controls from Pakistan, and (D) COVID-19 Patients from Pakistan. In patients where multiple time points were available, the latest time point post-onset of symptoms is shown.

