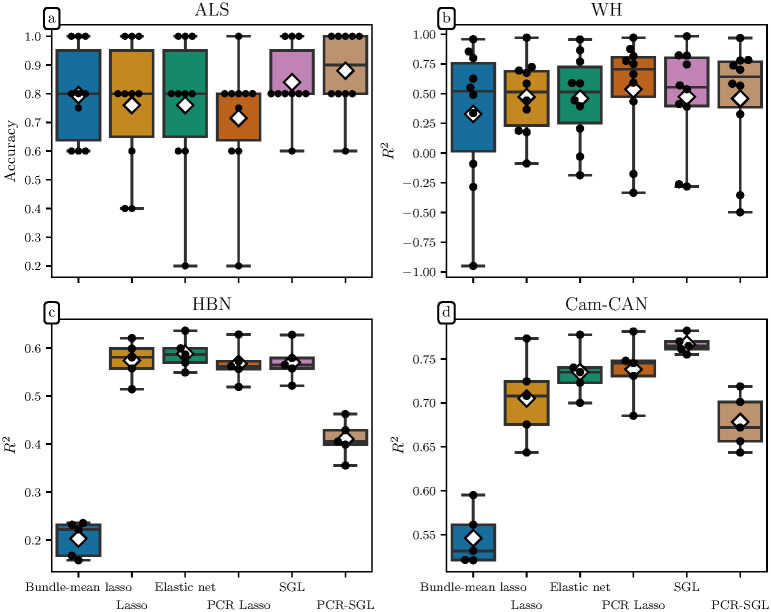
Fig 4. Model performance across all datasets.
Each panel shows model performance measured on the test set for each cross-validation split, with each black dot representing a split, box plots representing the quartiles, and white diamonds representing the mean performance. The y-scale varies in each subplot. (a) Accuracy of test set predictions for the ALS dataset. Because group differences in ALS diagnosis are mostly confined to a single bundle, the group structure-preserving methods, SGL and PCR-SGL, outperform the other models. The remaining frames show coefficient of determination, R2 in test sets for the (b) WH, (c) HBN, and (d) Cam-CAN datasets. Because aging affects the white matter globally, group structure-blind methods like elastic net and PCR Lasso perform well. Nonetheless, the SGL models show competitve predictive performance, adapting to a problem where group structure is not as informative. PCR-SGL performs poorly in this regime because its initial group-wise PC projection destroys between bundle covariance. The bundle-mean lasso performs poorly, demonstrating the value of along-tract profiling.

