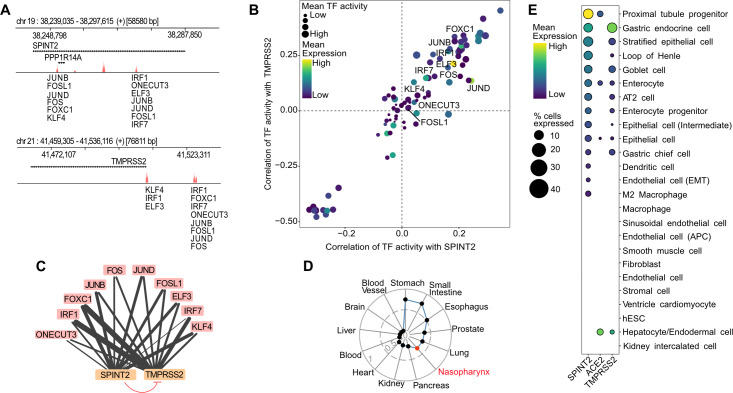
Fig 1. Coregulation of SPINT2 and TMPRSS2.
A. Peaks associated to open chromatin sites in regions containing the SPINT2 and TMPRSS2 genes (+/- 5kb of the coding regions) using ATAC-seq data from Human Intestinal Organoids. TF Binding Sites (TFBS) are scored based on the height and width of the peaks and the similarity of the sequences in the peaks to TF motifs. B. Correlation values of TF activities to SPINT2 and TMPRSS2 gene expression levels using scRNA-seq data from ileum derived organoids. Labeled TFs in (A) and (B) correspond to the intersection of inferred TFs bound to TFBS in (A) and those with positive correlation of TF activities to both SPINT2 and TMPRSS2 in (B), top right quadrant. C. Model for SPINT2 and TMPRSS2 coregulation. Edges from TFs (blue) to SPINT2 and TMPRSS2 (salmon) represent inferred binding shown in (A), (B) and the edge width reflects TF binding scores. The blunt red arrow represents the inhibition of TMPRSS2 enzymatic activity by SPINT2. D. Correlation of SPINT2 and TMPRSS2 across tissues using bulk RNA-seq from GTEx. The additional red point labeled as nasopharynx represents the correlation of an independent dataset from nasopharynx tissue of COVID-19 patients. E. Gene expression of ACE2, SPINT2 and TMPRSS2 across cell types using HCL scRNA-seq data. EMT: Endothelial to Mesenchymal Transition. APC: Antigen Presenting Cell. hESC: human Embryonic Stem Cells.

