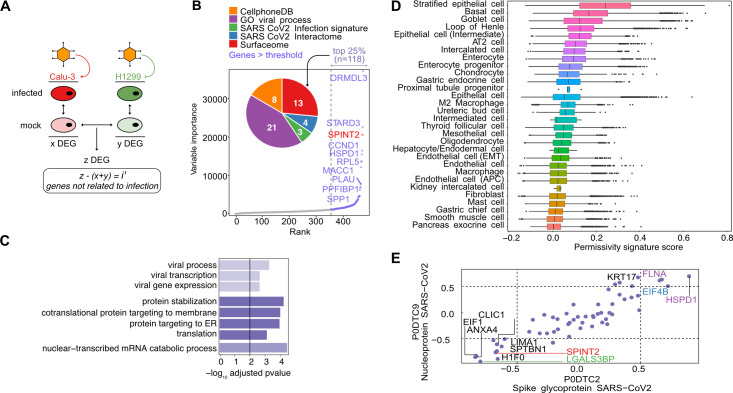
Fig 2. Permissivity genes are associated to viral related processes and correlated to viral expression.
A. Permissivity signature genes (z) were found using differential gene expression analysis (DEA) between Calu-3 and H1299 permissive and non-permissive cell lines. Similarly, infection signatures for both cell lines were calculated independently (x + y) and filtered out from the permissive signature (z) resulting in (i’). B. Permissive genes ranked by importance in predicting the cumulative sum of gene expression of viral genes. Only the top 10 ranked genes are labeled with names. Top 25% genes are shown in color and SPINT2 is highlighted in red. The inset plot show the number of genes in the intersection with each geneset. See the main text for the description of each gene set. C. Pathway Enrichment Analysis of the top 25% ranked genes. D. Ranking of cells in HCL using the permissivity scores based on the same genes as in (B) and (C). E. Correlation to viral proteins (S and N genes) in the translatome data of Caco-2 cells. Gene names are coloured as in the pie chart in (B). APC: Antigen Presenting Cells. AT2: Alveolar Type 2 cells.

