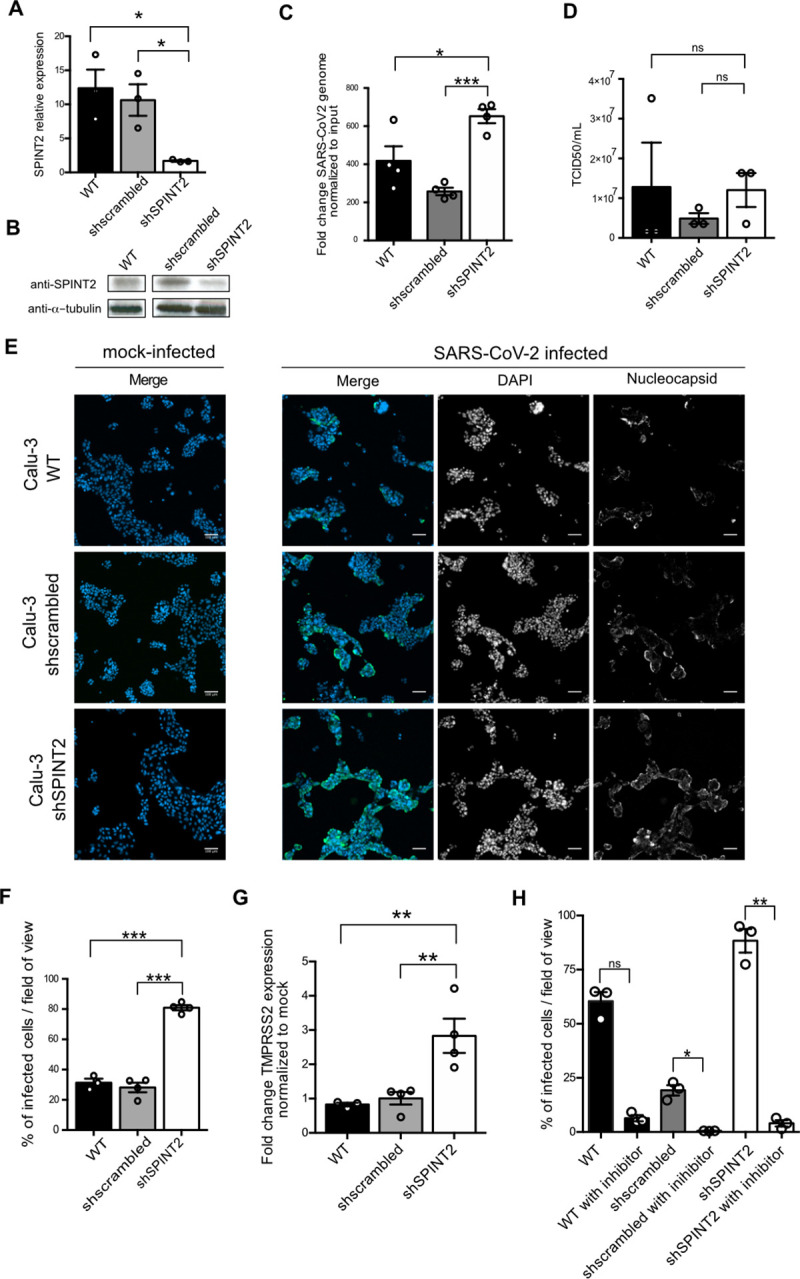
Fig 3. SPINT2 knockdown in Calu-3 cells promotes SARS-CoV-2 infection.

A. Relative expression of SPINT2 normalized to the housekeeping gene TBP in wild type Calu-3, scrambled-treated and SPINT2 KD Calu-3 cells. B. Western blot of SPINT2 and ɑ-tubulin as control in wild type, sh-scrambled and SPINT2 KD Calu-3 cells. C. Quantification of SARS-CoV-2 replication. RNA was harvested at 24hpi, and q-RT-PCR was used to evaluate the copy number of the SARS-CoV-2 genome. Data are normalized to inoculum used for infection. D. Quantification of de-novo virus particles released by WT, sh-scrambled and SPINT2 KD cells. E. Representative immunofluorescence images of Calu-3 wild type (WT) cells and cells treated with scrambled control shRNA (sh-scrambled) and shRNA targeting SPINT2 (shSPINT2) for mock-infected and SARS-CoV-2 infected conditions. Infection was detected by indirect immunofluorescence against the nucleocapsid N and Nuclei were stained with DAPI. F. Quantification of the percentage of SARS-CoV-2 infected cells from C. G. Quantification of TMPRSS2 expression upon SPINT2 silencing. q-RT-PCR was used to evaluate the expression level of TMPRSS2 in WT, sh-scrambled and SPINT2 KD Calu-3 cells. Relative expression level of TMPRSS2 in SARS-CoV-2 infected cells normalized to that of the mock-infected cells. H. Quantification of the percentage of SARS-CoV-2 infected cells for WT, sh-scrambled and SPINT2 KD Calu-3 cells mock-treated or treated with the TMPRSS2 inhibitor camostat mesylate. Infection was detected by indirect immunofluorescence using an anti-nucleocapsid antibody at 24hpi. Data are normalized to inoculum used for infection. Error bars indicate standard deviation. n = 3 biological replicates. P<0.05 *, P<0.01 **, P<0.001 ***, P<0.0001 ****. Analysis was done by a two-tailed unpaired t-test with Welch’s correlation for the respective cell lines.
