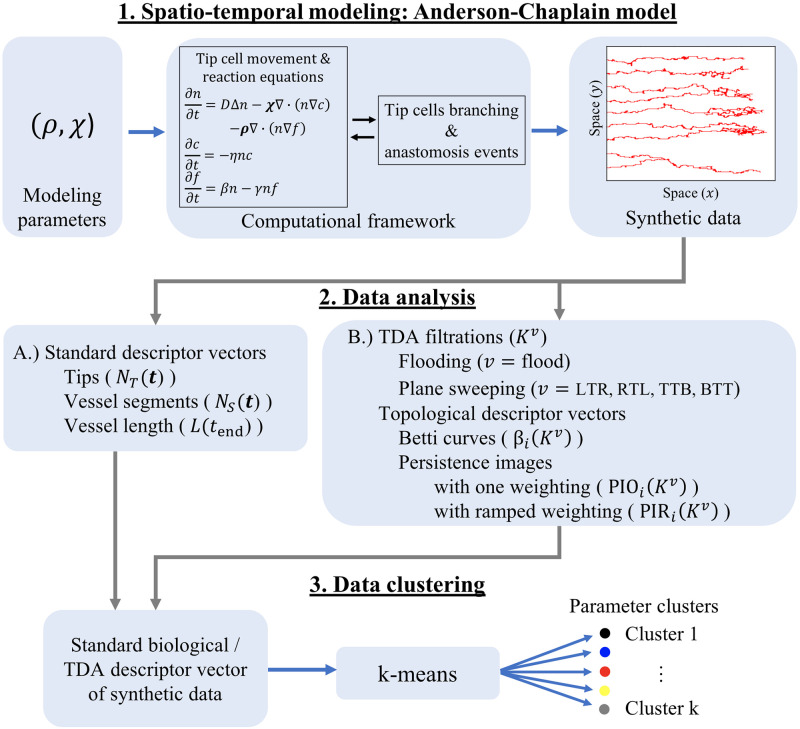
Fig 2. Data generation and analysis pipeline.
(1) Spatio-temporal modeling: Anderson-Chaplain model. The Anderson-Chaplain model is simulated for 11 × 11 = 121 different values of the haptotaxis and chemotaxis parameters, (ρ, χ). The model output is saved as a binary image, where pixels labeled 1 or 0 denote the presence or absence, respectively, of blood vessels. We generate 10 realizations for each of the 121 parameter combinations, leading to 1,210 images of simulated vessel networks. (2) Data analysis. We use the binary images from Step 1 to generate standard and topological descriptor vectors A.) Standard descriptor vectors We compute the number of active tip cells and the number of vessel segments at discrete time points. We also compute the length of the vessels at the final time point [32, 34, 35, 52]. B.) Topological descriptor vectors. We construct flooding and sweeping plane filtrations [44] using binary images from the final timepoint of each simulation. We track the birth and death of topological features (connected components and loops) that are summarized as Betti curves and persistence images [52]. (3) Data clustering. We perform k-means clustering using either the standard or topological descriptor vectors computed during step 2 from all 1,210 simulations. In this way, we decompose (ρ, χ) parameter space into regions that group vessel networks with similar morphologies.

